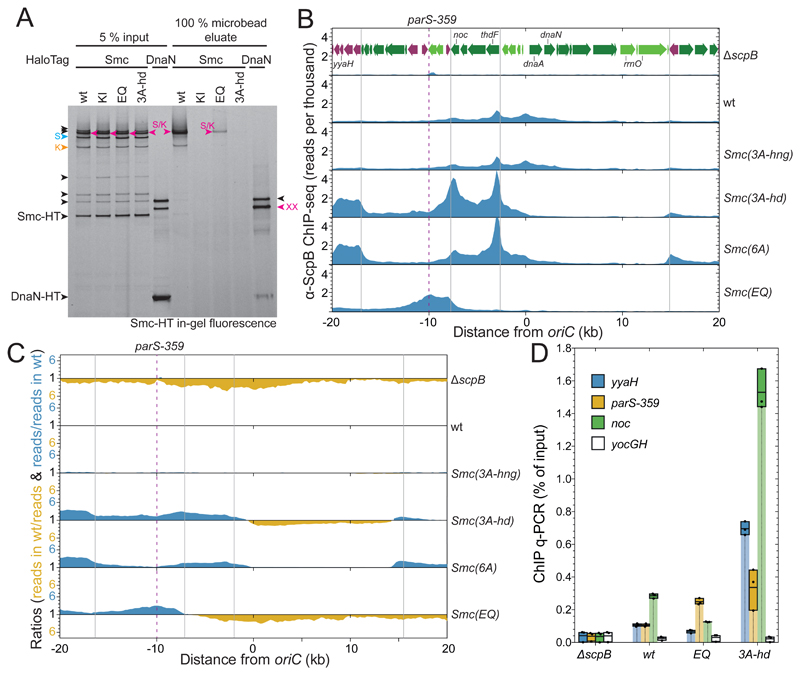
Figure 6. Chromosomal association and distribution of Smc(3A-hd).
(A) Chromosome entrapment assay using agarose microbeads. Smc-HT and DnaN-HT species labelled by HaloTag-TMR were analyzed by SDS-PAGE and in-gel fluorescence detection. As in Figure 1D. All Smc-HT samples harbor K-Cys and S-Cys for cross-linking of the two Smc/ScpA interfaces and the Smc hinge, respectively. The circular S/K species is indicated in magenta colors. All other labeling as in Figure 1B.
(B) ChIP-Seq profiles for the replication origin region represented as normalized reads per thousand total reads. ChIP was performed with a polyclonal antiserum raised against the ScpB protein. Gene organization in the origin region is shown in the ΔscpB panel. Genes in highly-transcribed operons are displayed in green colors. Gray lines indicate the 3’ end of highly transcribed operons. The position of parS-359 is given by a dashed line.
(C) Ratiometric analysis of wild-type and mutant ChIP-Seq profiles shown in (B). For bins with read counts greater than the wild-type sample, the ratio was plotted above the genome coordinate axis (in blue colors). Otherwise the inverse ratio was plotted below the axis (in yellow colors).
(D) α-ScpB ChIP-qPCR. Selected loci in the replication origin region and at the terminus were analyzed by quantitative PCR. Each dot represents a data point from one out of three experiments. The solid boxes span from the lowest to the highest value obtained; the horizontal line corresponds to the mean value calculated from the three biological replicates.
See also Figure S6.

