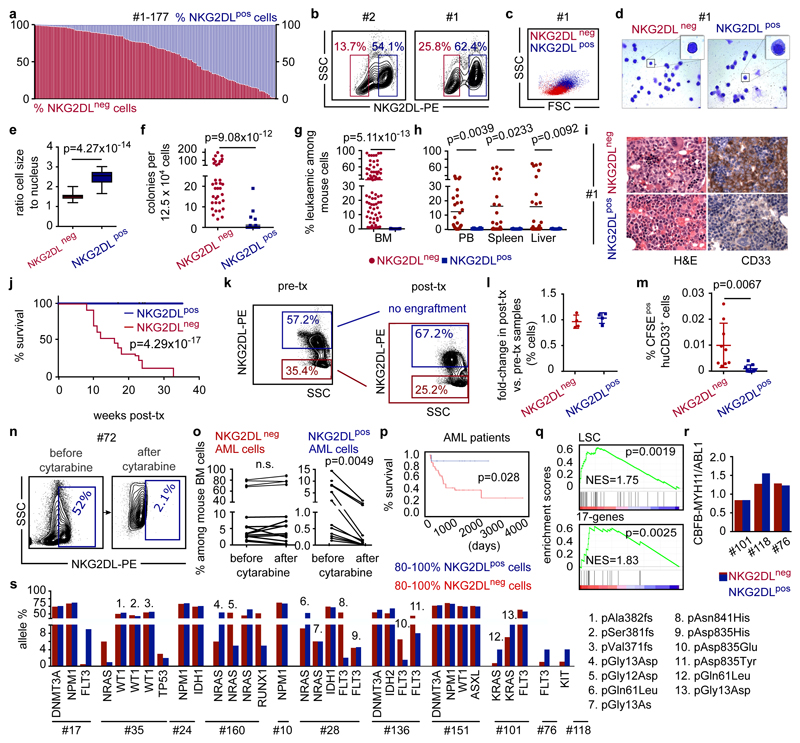
Figure 1. Absence of immunostimulatory NKG2DLs identifies chemotherapy-resistant LSCs.
a, Flow cytometry analysis using NKG2D– Fc to determine percentages of NKG2DL− (red) and NKG2DL+ (blue) AML cells in 177 cases of AML (Supplementary Table 1). b–m, NKG2DL− and NKG2DL+ subpopulations of AML cells are sorted from the same patients, and analysed side-by-side using equal cell numbers. b, Representative examples of the gating strategy. c, Representative examples of forward and sideward scatter plots. d, Representative examples of May–Grünwald– Giemsa staining. e, f, Quantification of cell-to-nucleus size ratio (e) (n = 50 cells quantified for each subpopulation, n = 5 cases of AML; boxes represent median and 25th–75th percentiles, whiskers are minimum to maximum) and in vitro colony formation (f) (means of technical triplicates, n = 38 cases of AML). g–i, Long-term engraftment in NSG mice. Flow cytometry of mouse bone marrow (BM) (g; n = 18 cases of AML), and peripheral blood (PB) and organs (h; n = 10 cases of AML). Each dot represents one mouse. i, Representative bone marrow histopathology images. Left, haematoxylin and eosin (H&E); right, anti-CD33, 630× magnification, n = 5 cases of AML, n = 3 mice per group). j, Kaplan–Meier survival analyses. Transplanted mice per case of AML for NKG2DL− cells: 5 for no. 1, 6, 7, 8, 12 and 110; 4 for no. 34; 3 for no. 76, 111, 119, 133 and 168; 2 for no. 72. Transplanted mice per case of AML for NKG2DL+ cells: 7 for no. 76; 6 for no. 110; 5 for no. 1, 6, 7, 8 and 12; 3 for no. 72, 111, 133 and 168; 4 for no. 34 and 119. k, l, Quantification of NKG2DL− and NKG2DL+ AML cells from engrafted mice (post-transplantation) compared to corresponding patient-derived samples (pre-transplantation). Representative plots (k) and summarized results (l) (no. 1, 7 and 8, n = 3; no. 6, n = 4 mice per subpopulation). m, Percentage of CFSE-labelled human CD33+ AML cells that home to the bone marrow (each dot represents 1 mouse, n = 3 mice per subpopulation, n = 3 cases of AML). n, o, Mice engrafted with AML cells were treated with cytarabine (1 mg subcutaneously daily, for 2 to 4 days), and percentages of NKG2DL− and NKG2DL+ AML cells analysed in the mouse bone marrow before and after treatment. n, Exemplary results. o, n = 8 cases of AML. Connected dots depict percentages of NKG2DL− (left) and NKG2DL+ (right) AML cells before and after treatment in one mouse. p, Correlation of surface expression of NKG2DLs and overall survival in patients with AML (≤65 years old with ≥ 80 NKG2DL+ (n = 10) versus ≥ 80% NKG2DL− cells (n = 32)). q–s, LSC, 17-gene stemness signatures and leukaemia-specific genetic aberrations in NKG2DL− versus NKG2DL+ cells. q, Gene-expression array and GSEA analyses (no. 1, 6, 7, 8 and 12). r, Quantitative PCR with reverse transcription (qRT–PCR). s, Targeted next-generation sequencing. e–h, m, Mann–Whitney U test. j, p, log-rank (Mantel–Cox) test. o, Wilcoxon test. q, Nominal P value and normalized enrichment score (NES). Except in o, statistical tests were two-sided. Centre values in f–h and l–m represent mean, error bars represent s.d.

