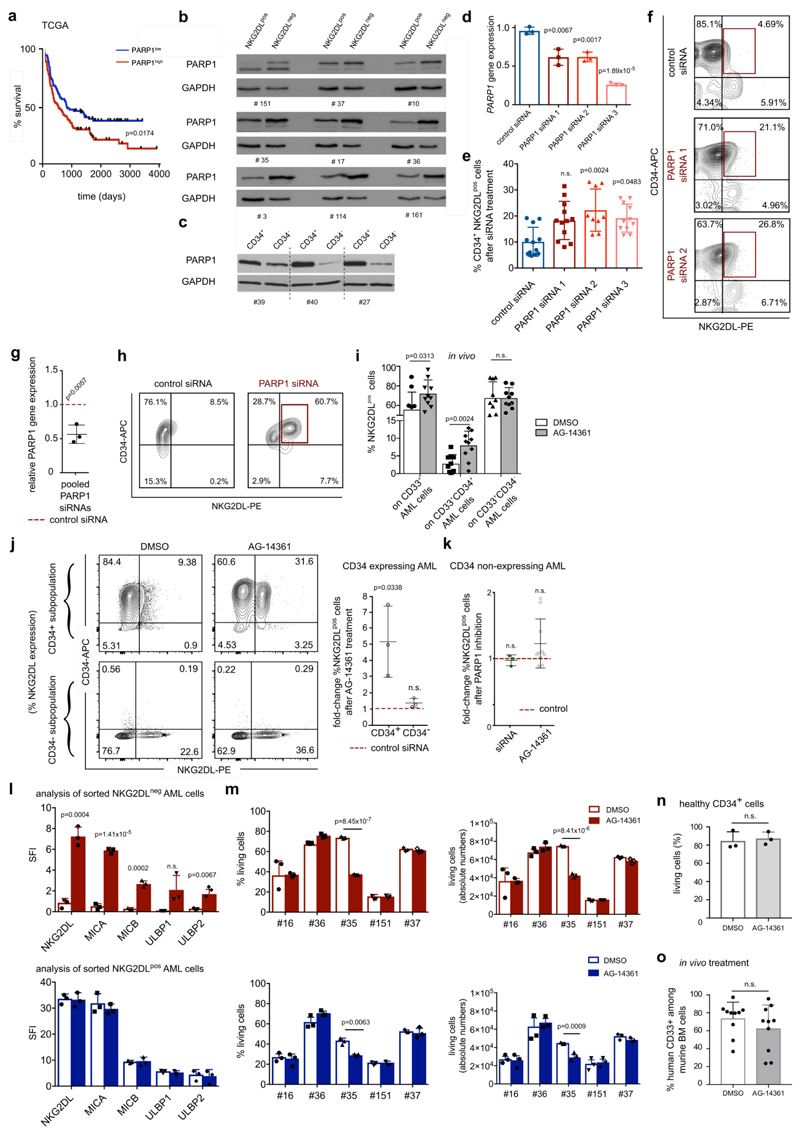
Extended Data Fig. 8. PARP1 in human AML: expression, association with clinical outcome and induction of NKG2DLs after PARP1 inhibition.
a, Survival analysis of patients with AML with high (above median, red line) versus low (below median, blue line) expression of PARP1 mRNA (TCGA, n = 179 patients). b, c, Immunoblot analyses of expression of PARP1 protein in NKG2DL− compared to NKG2DL+ AML cells (b) and CD34+ compared to CD34− AML cells (c), sorted from the same patient samples. n = 9 for b, n = 3 for c; experiments were repeated twice independently with similar results. GAPDH and actin were used as loading controls. Quantifications are shown in Supplementary Table 6. d–h, Treatment with individual (d, n = 3; e, n = 12; f, no. 42) or pooled (g, h, n = 3) PARP1 siRNAs for 24 h inhibits expression of the PARP1 gene (d, g; qRT–PCR, GAPDH used as housekeeping control) and induces surface expression of NKG2DLs on human CD34+ AML cells (e, f, h, no. 38) (control, scrambled non-coding PARP1 siRNAs). Each dot represents a different patient analysed in technical triplicates. i, Analysis of expression of NKG2DLs on engrafted human AML subpopulations (percentage of NKG2DL+ within CD33+, CD33+CD34+ and CD33+CD34−subpopulations derived from mouse bone marrow) after five days of in vivo treatment with AG-14361 or DMSO (n = 10 mice per group, n = 3 cases of AML). j, k, Analysis of surface expression of NKG2DLs after in vitro treatment with AG-14361 (20 μM, 24 h) or DMSO in sorted CD34+ and corresponding CD34− AML cells (j, left, representative results; right, summarized fold changes of NKG2DL+ cells in AG-14361 versus DMSO cultured cells; n = 3 cases of AML) or in bulk AML cells from non-CD34-expressing cases of AML (k, n = 10 cases of AML). Summarized fold changes in NKG2DL+ AML cells in PARP inhibition versus corresponding control conditions are shown. l, m, Sorted NKG2DL− (top panels) and corresponding NKG2DL+ (bottom panels) AML subpopulations were treated for 24 h with AG-14361 (20 μM) or DMSO (0.2%) and analysed by flow cytometry for MICA, MICB, ULBP1 or ULBP2, ULBP5 or ULBP6 surface expression (l, SFI; no 16, 35 and 151) and using DAPI (m) to determine viability (left) and absolute cell numbers (right) (n = 5 cases of AML). Mean values of technical triplicate analyses are shown. n, Corresponding analyses with healthy CD34+ cells from n = 3 samples of cord blood. o, Leukaemic bone marrow infiltration after in vivo treatment with AG-14361 (days 1 to 5, 10–15 mg kg−1 day−1) or DMSO (days 1 to 5, 20%) in n = 10 mice for each group. Statistical analyses were performed using a log-rank (Mantel–Cox) test (a), a two-sided Mann–Whitney U test (k, o) or a two-sided Student’s t-test (all other plots). Each dot represents the mean of technical triplicates per patient sample. Centre values represent mean, error bars represent s.d.

