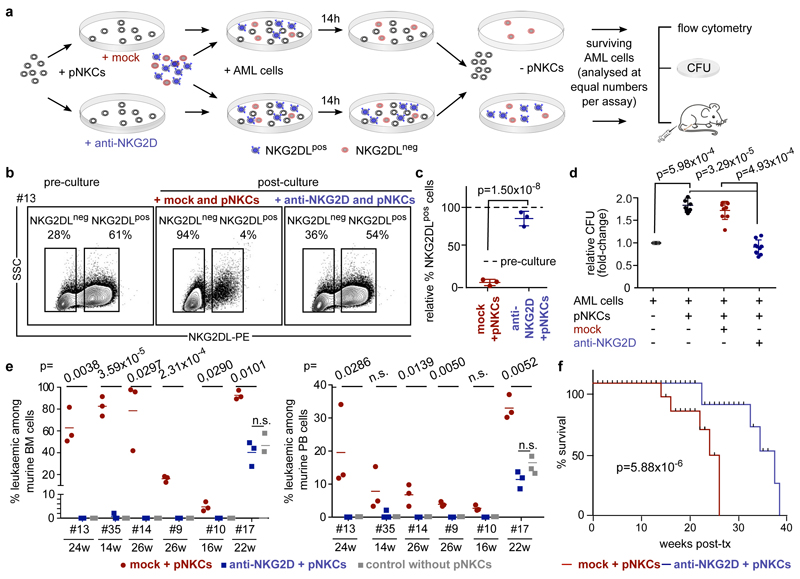
Figure 2. NK cells preferentially lyse non-LSCs.
a–f, AML cells cultured alone or with pNKCs (10/1 pNKC/AML ratio) pre-treated with isotype control (mock + pNKCs, red) or blocking anti-NKG2D F(ab′)2 6H7 (anti-NKG2D + pNKCs, blue) were analysed. a, Schematic overview. b, Representative flow cytometry analysis. c, Quantification showing percentages of NKG2DL+ AML cells in mock- and anti-NKG2D-treated groups relative to corresponding pre-culture cells (n = 3 cases of AML). d, Quantification of colony numbers (means of technical triplicates, n = 9 cases of AML). e, f, In vivo engraftment in NSG mice obtained with AML cells from different conditions (n = 3 mice per patientand condition; n = 6 cases of AML; each dot or square represents one mouse). Leukaemic engraftment at time of first leukaemia detection (e, bone marrow, left; peripheral blood, right) and survival (f, Kaplan– Meier survival analysis) in mice transplanted with AML cells from mock + pNKCs (red) or anti-NKG2D + pNKCs (blue) co-cultures. Centre values represent mean, error bars represent s.d. log-rank (Mantel–Cox) testwithn=18miceperarm(n=3percasesofAMLandgroup) performed in f; two-sided Student’s t-test performed in c–e.

