Fig. 2.
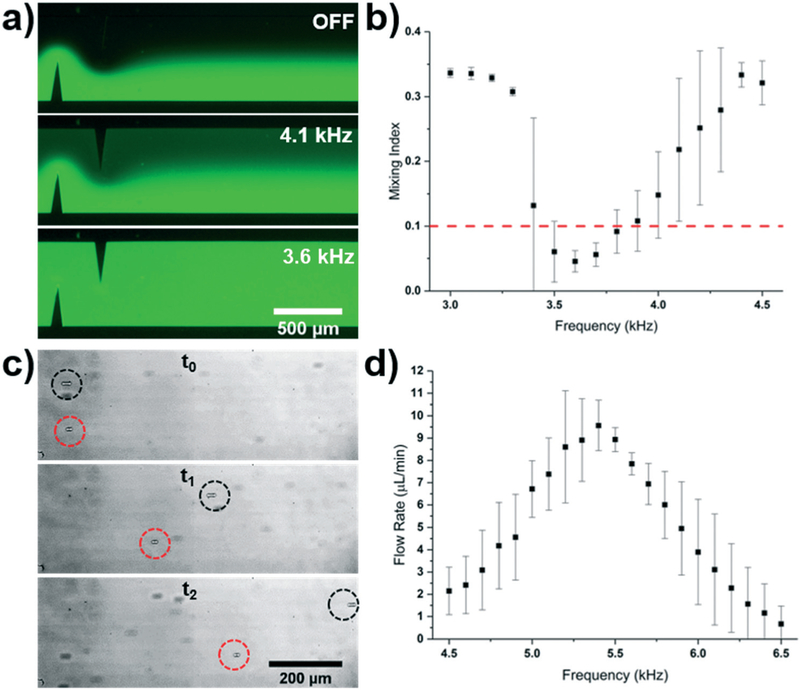
a) Fluorescent mixing achieved when applying varying frequencies to the sharp-edge based acoustofluidic device. b) Plot of the mixing index versus frequency for the sharp-edge based acoustofluidic mixer controlled by the Arduino system. A 35 V signal and a 10 μL min−1 total flow rate was used for the mixing experiment. c) Overlaid particle tracing when the sharp-edge based acoustofluidic micropump was operated at two different frequencies. Both particles were pumped with a 30 V signal; the black and red circles track particles pumped using a 5.4 kHz and 6.1 kHz signal, respectively. Time between t0 and t2 was 288 ms. d) Plot of the pumping flow rate versus frequency for the sharp-edge based acoustofluidic micropump controlled by the wall-powered Arduino system. A 30 V signal was applied to the sharp edge pump.

