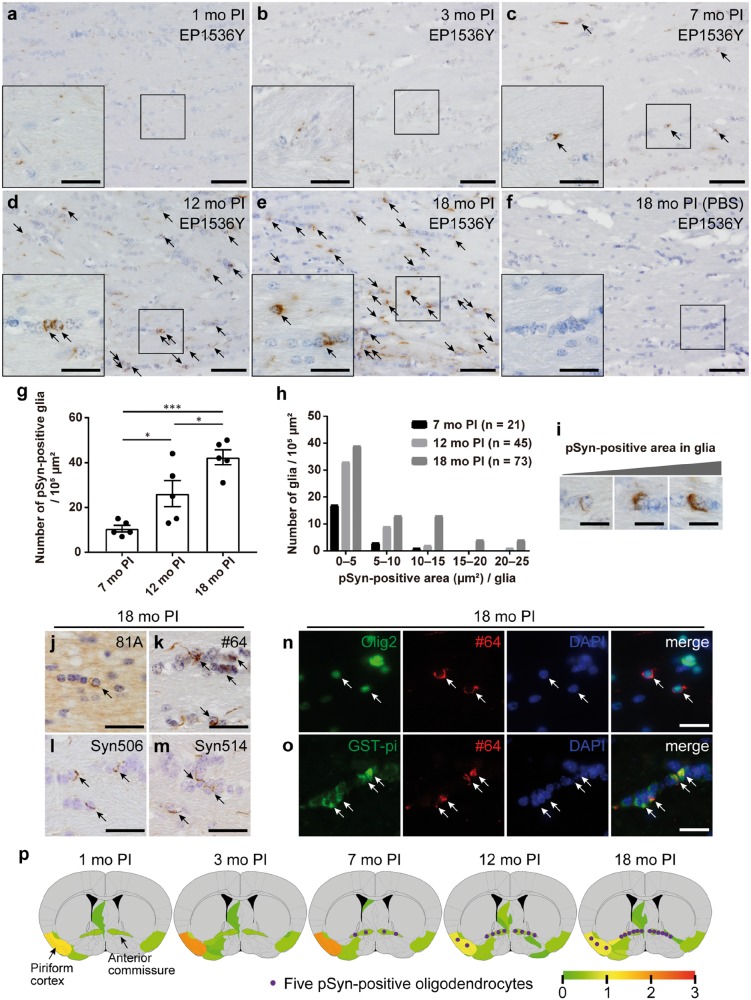
FIGURE 3.
Progressive oligodendroglial alpha-synuclein (α-Syn) pathology in the anterior commissure of the mice injected with mouse α-Syn (m-α-Syn) preformed fibrils (PFFs) into the olfactory bulb. (A–F) Phosphorylated α-Syn (pSyn) immunohistochemistry (EP1536Y) in the anterior commissure. Note glial pSyn pathology (arrows in C–E). No pSyn pathology is seen in the mice injected with phosphate-buffered saline (F). (G) Quantification of the number of glia with EP1536Y-positive pSyn pathology in the anterior commissure of the mice injected with m-α-Syn PFFs (n = 5). One-way ANOVA with Tukey’s multiple-comparisons test was performed; *p < 0.05, ***p < 0.001. Data are the mean ± SEM. (H) Distribution of pSyn (EP1536Y)-positive area of each glial cell at 7, 12, and 18 months after injections of m-α-Syn PFFs. (I) Representative images of glia with small to large EP1536Y-positive pSyn aggregates. (J–M) Immunohistochemistry assessing pSyn (81A and #64) or misfolded α-Syn (Syn506 and Syn514) shows pSyn-positive or misfolded α-Syn-positive glia (arrows) at 18 months after injections of m-α-Syn PFFs. (N) Double immunofluorescence staining for oligodendrocyte transcription factor 2 (Olig2) (green) and pSyn (#64, red). pSyn-positive pathology in Olig2-positive oligodendrocytes (arrows). (O) Double immunofluorescence for glutathione S-transferase pi (GST-pi) (green) and pSyn (#64, red). pSyn-positive pathology in GST-pi-positive mature oligodendrocytes (arrows). (P) Semiquantitative analysis of α-Syn pathology based on pSyn immunohistochemistry (EP1536Y) at 1-, 3-, 7-, 12-, and 18-month postinjection. Representative coronal planes (0.26 mm relative to bregma) containing the piriform cortex and anterior commissure are shown here, and 8 additional coronal planes at 4.28, 2.80, 2.10, 1.78, −1.58, −2.92, −4.04, and −5.34 mm relative to bregma are shown in Supplementary DataFigure S6. Left is the injection side. Heat map colors represent the extent of neuronal α-Syn pathology (gray [0], no pathology; red [3], maximum pathology). Scores were averaged among mice for each group (n = 3). Oligodendroglial α-Syn aggregates were counted and averaged across all mice in each group, then depicted schematically on the heat maps as purple dots (1 dot per 5 pSyn-positive oligodendrocytes). Scale bars: 50 µm (A–F), 20 µm (A–F insets, J–O), 10 µm (I).

