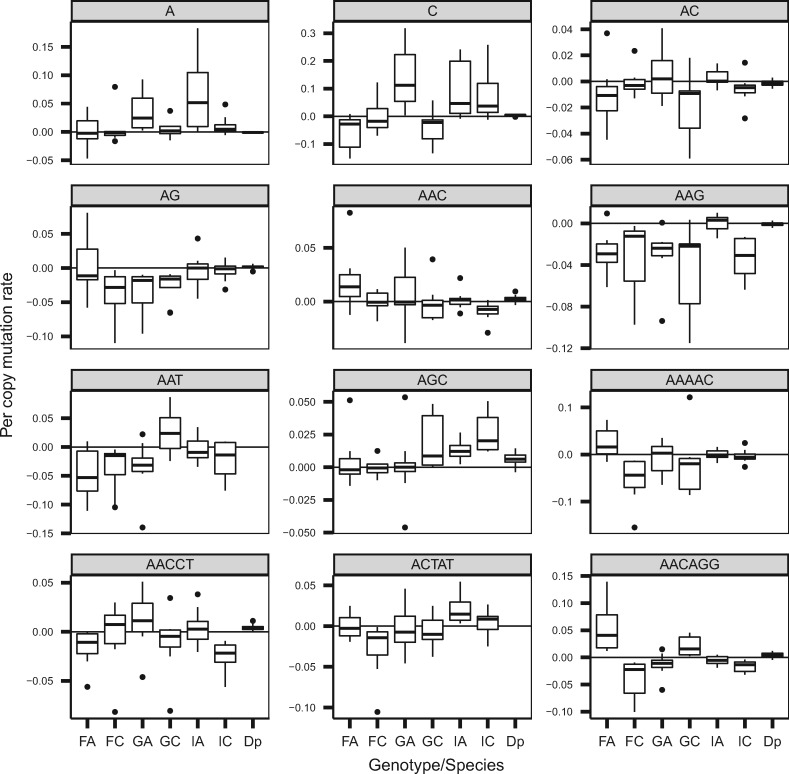
Fig. 6.
Per copy mutation rate for the 12 k-mers with the highest copy number across for six genotypes of Daphnia magna collected from three locations, Finland (F), Germany (G), and Israel (I). Dp represents the per copy mutation rate for Daphnia pulex. Points indicate lines with per copy mutation rates less than Q1 − 1.5*IQR or larger than Q3 + 1.5*IQR. Q1, Q3, and IQR represent the first quartile, third quartile, and the interquartile range, respectively.

