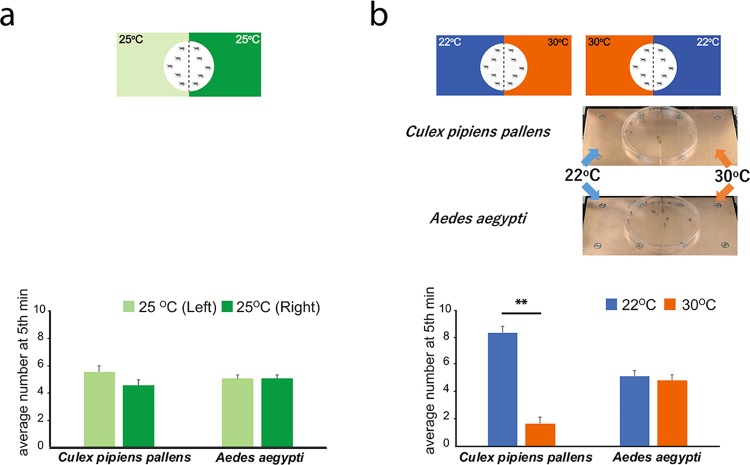
Figure 4.
Comparison of temperature preference behaviors between Culex pipiens pallens and Aedes aegypti. (a) Schematic representation of the comparison between left and right side of the Peltier plate (25 °C). The average numbers of mosquito count at the 5th minute in different areas of the Peltier plate are shown. n = 10 for each trial and 5 trials were performed. (b) Schematic representation of the comparison between 22 °C and 30 °C with representative results. The average numbers of mosquito count at the 5th minute in different areas of the Peltier plate are shown. n = 10 for each trial and 5 trials were performed, **P < 0.01, unpaired Student’s t-test.

