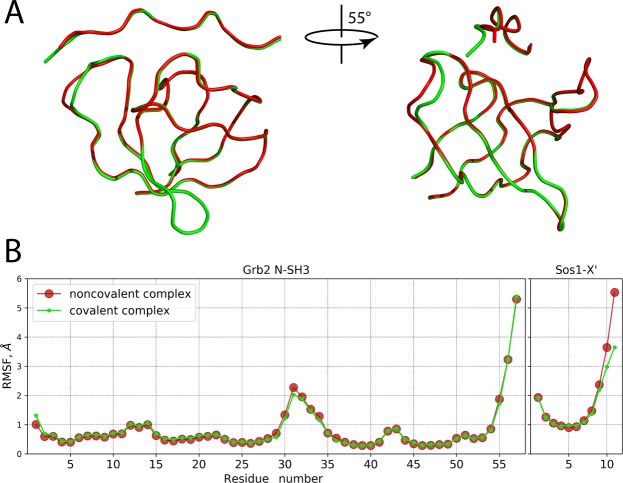
Figure 5.
(A) Superposition of Cα traces representing the average coordinates of the MD models of SH3·Sos1-X′ and SH3:Sos1-X′ (red and green color, respectively). The perspective in the right portion of the plot offers a clear view of conformational changes in the n-Src loop. For positions of individual residues, consult Fig. S7. (B) Root mean square fluctuation (rmsf) characterizing the mobility of Cα atoms in the MD models of SH3·Sos1-X′ and SH3:Sos1-X′. Prior to calculating rmsf all MD snapshots were superimposed with respect to Cα atoms from the secondary-structure regions of the SH3 domain.

