Figure 1.
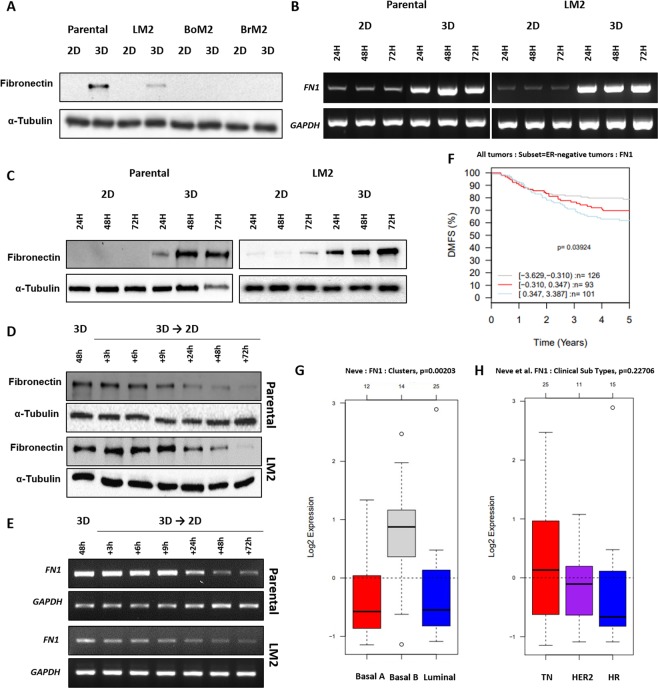
Changes in fibronectin expression of TNBCs in 3D and in vivo gene set analysis. (A) MDA-MB-231 parental, LM2, BoM2, and BrM2 were cultured in 2D or 3D condition for 48 hours, and the level of fibronectin protein was detected and the blots were cropped from different parts of the same gel. The mRNA levels (B) and protein levels (C) were monitored at 24, 48, and 72 hour in MDA-MB-231 parental and LM2 cells grown in 2D or 3D condition using electrophoretic gels and immunoblots, respectively. And the bands of blots were cropped from the same gel for each cell line (parental and LM2). MDA-MB-231 parental and LM2 cells cultured in 3D suspension conditions were transferred in 2D culture plates, and changes in fibronectin protein (D) and mRNA (E) expression were detected and the PCR products were observed using electrophoretic gels. (F) Kaplan-Meier survival analysis showing the relationship between FN1 gene expression and 5-year distant metastasis free survival outcomes in patients with ER-negative breast cancer. (G) A box plot exhibiting variation of FN1 gene expression according to breast cancer subtypes; basal-A, basal-B and luminal. (H) A box plot of FN1 gene expression in different breast cancer cell lines using GOBO gene-set analysis. TN; triple negative breast cancer cell lines, HER2; HER2-positive breast cancer cell lines, and HR; Hormone receptor positive breast cancer cell lines.

