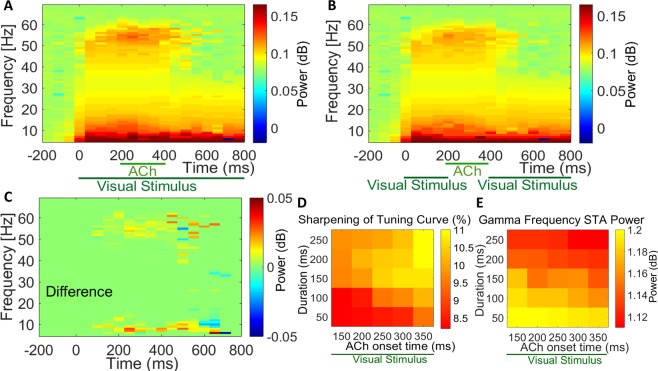
Figure 6.
Interaction of Acetylcholine Application Relative to Visual Stimulation and with Different Onset Times and Duration of Administration on STA LFP Frequency Spectra. (A) Before cholinergic modulation power at high frequencies is clearly modulated by spiking activity whereas pairing of cholinergic modulation with visual stimulation, caused a significant decrease in gamma frequency power. Visual stimulation lasted 800 ms, shown on the abscissa. (B) as (A), ACh was applied in the absence of visual stimuli which leads to gamma oscillations reduction. (C) The difference between time frequency power spectra STA LFP, when ACh was applied in the presence and absence of visual stimuli. (D) Effects of ACh with different onset application times with respect to different duration of administration on the percent of tuning curve sharpening compared to the baseline and (E) the gamma frequency power.

