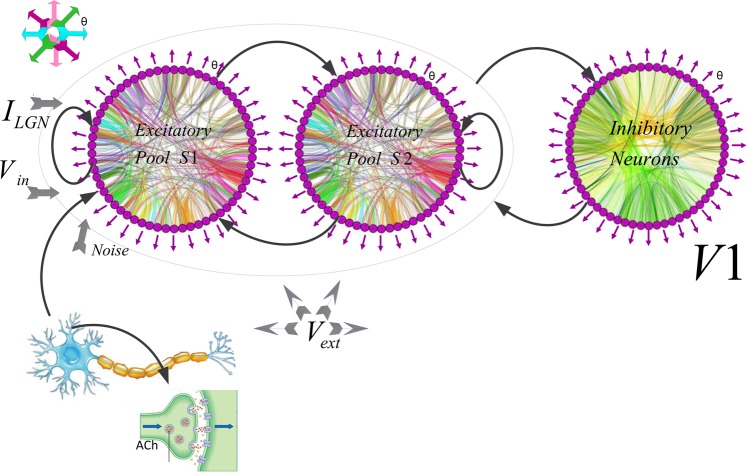
Figure 7.
Model Architecture and Representation. The network module consists of excitatory and inhibitory neurons. Each circle is a population of Neurons. The excitatory neurons are organized in two groups of selective (S1 and S2) and a group of inhibitory neurons. All the neurons get an input (νext) which simulates the spontaneous activity in the surrounding cerebral cortex. The neurons in the first excitatory group receive the input encoding the stimulus (νin). ILGN represented feed-forward excitatory input from LGN to the network. The orientation preference θ of each neuron was uniformly distributed between −90 and 90 degrees. The distribution’s orientation at angle θ in the visual field sets the orientation preference that indicated via purple arrows schematically. The color curves in each circle represents the Gaussian connections. Neurons are connected through recurrent connections mediated the excitatory and inhibitory inputs to neurons through connections with a Mexican hat profile (not all connections shown). Between-pool connections (weights from the inhibitory to the excitatory pools) and recurrent connections present with black arrows. See Methods for details. NetworkX Simulator123 was used to generate the figure.

