Figure 2.
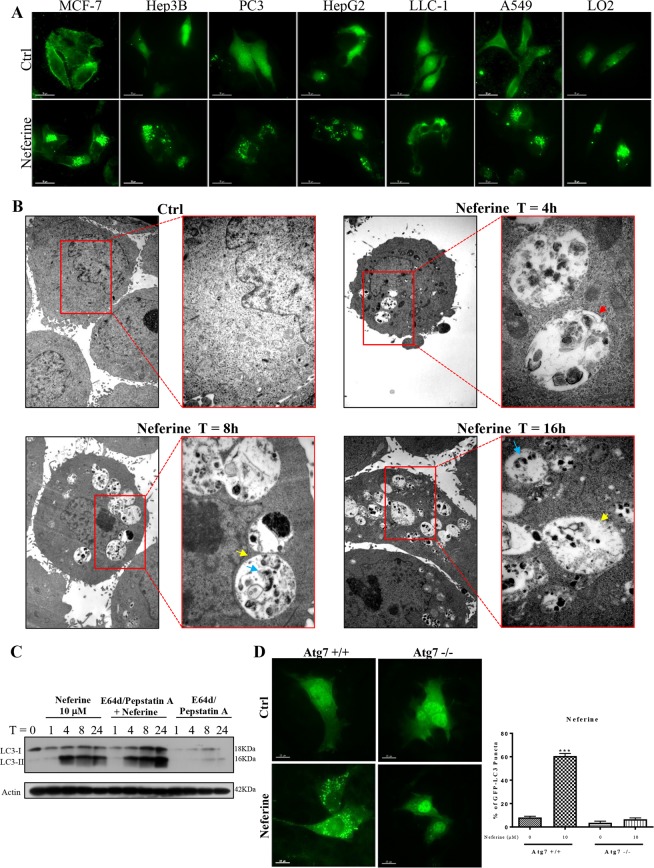
Neferine-induced autophagy and LC3-II conversion depend on autophagic gene, Atg7. (A) EGFP-LC3 puncta detection of neferine-mediated autophagy in other cancer and normal cells. Cancer cells (MCF-7, Hep3B, PC3, HepG2, LLC-1, and A549) and normal liver hepatocytes (LO2) were transiently transfected with the EGFP-LC3 plasmid for 24 h and then treated with DMSO (Ctrl), or 10 μM of neferine for 4 h. The quantification graph is presented in Supplementary Fig. S2. (B) Neferine induced the formation of autophagosomes and autolysosomes. Representative electron micrographs showing the ultra-structures of HeLa cells treated with neferine (10 μM) at indicated times. All images were captured with 40000X magnification; micrographs from red rectangle represent the magnified cropped images of the double-membrane autophagosomes (red arrow), autolysosomes (yellow arrow) and engulfed organelles (blue arrow). (C) Neferine induced autophagic flux in HeLa cells. Cells were treated with neferine (10 μM) in the presence or absence of 10 μg/mL lysosomal protease inhibitors (E64d and pepstatin A) for 24 h. Cell lysates were analyzed by western blot for LC3-II conversion (LC3-I, 18 kDa; LC3-II, 16 kDa), and actin respectively. The full-length blots/gels are presented in Supplementary Fig. S9. (D) Neferine-mediated autophagy depended on Atg7 expression. Both Atg7+/+ wild-type and Atg7−/− deficient MEFs were transiently transfected with the EGFP-LC3 plasmid for 24 h and then treated with DMSO (Ctrl) or 10 μM neferine for 4 h. The cells were then fixed for fluorescence imaging and cells counting. Bar chart represents the quantification of autophagic cells. Percentages of autophagic cells demonstrated by the increased number of cells with EGFP-LC3 dots signal (≥10 dots/cell) over the total number of EGFP-positive cells in the same field. More than 1000 EGFP-positive cells were scored for each treatment. Data are the means of three independent experiments; scale bar, 15 μm; error bars, S.D. ***P < 0.001 for Atg7+/+ MEFs treated with or without Nef.

