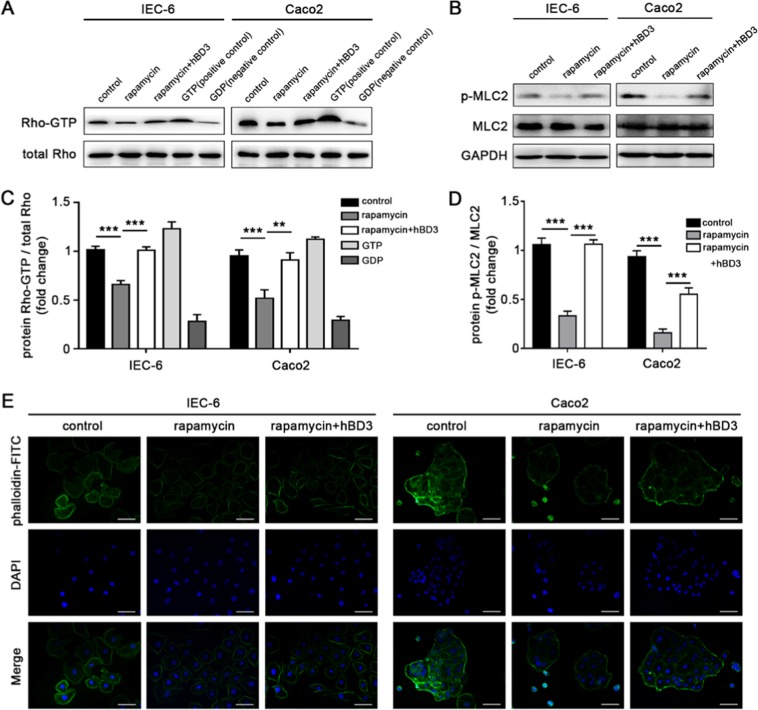
Figure 5.
hBD3 promoted intestinal epithelial cells migration via the Rho signaling pathway. Rho-GTP was extracted by pull-down assay and its expression levels in different groups were measured by western blotting (A) with the total Rho as an input control. GTP and GDP were respectively added to act as the positive and negative control. Relative Rho-GTP expression in each group was quantified. (C) The expression of p-MLC2 in each group was assessed by western blotting (B) with the total MLC2 as a loading control. Relative p-MLC2 expression in different groups were compared. (D) F-actin was stained with phalloidin- FITC and analyzed by fluorescence microscopy (E, scale bar, 50 μm). Data was expressed as mean ± SD from three independent experiments and representative images were presented. Abbreviations: GTP: guanosine triphosphate; GDP: guanosine diphosphate; MLC2: myosin light chain-2; FITC: fluorescein isothiocyanate. **p < 0.01, ***p < 0.001.

