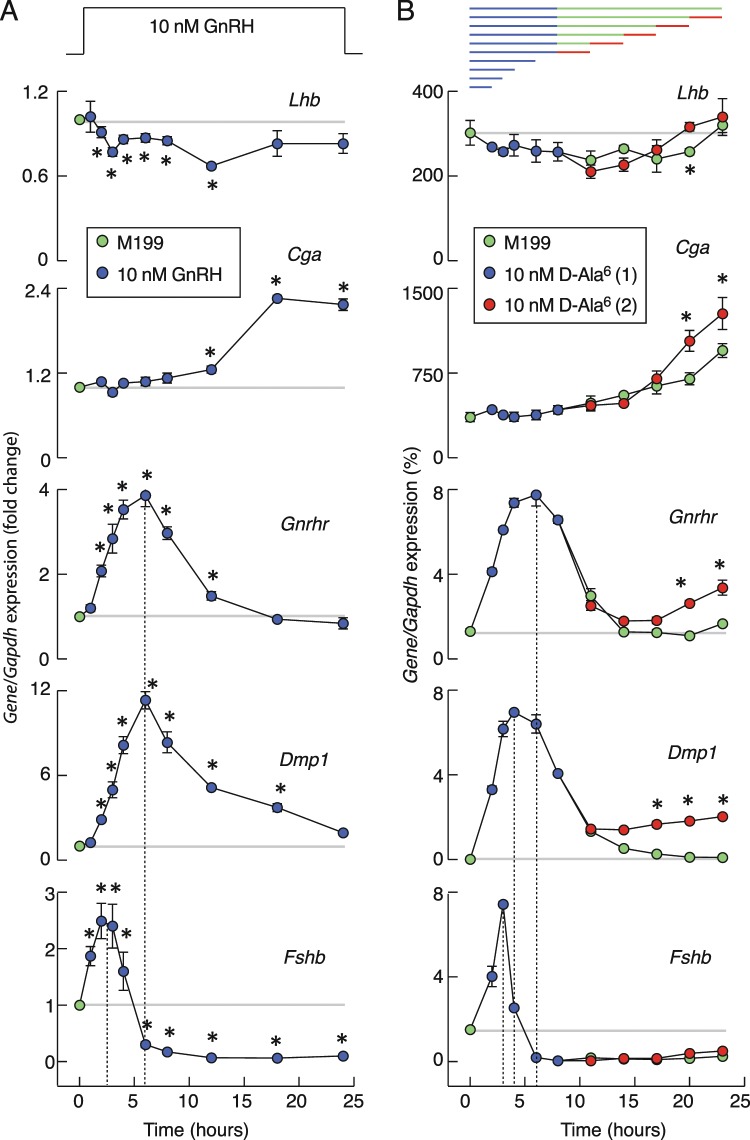
Figure 2.
Time-course of GnRH receptor agonists on gonadotropin subunit genes, Gnrhr, and Dmp1 expression in cultured pituitary cells. (A) Effects of continuous GnRH application on gene expression. Note the transient nature of Fshb, Gnrhr, and Dmp1 expression, a slow and continuous upregulation in Cga expression, and a transient and minor inhibition of Lhb expression during GnRH treatment. Data shown are mean ± SEM values, normalized to the zero time point controls, from three to nine independent experiments per time point, each performed in quadruplicate. Asterisks indicate significant differences vs. zero time point. (B) A gene-specific patterns of expression in response to application of D-Ala6. Top panel indicates duration of first (blue) and second (red) 10 nM D-Ala6 application and washout periods (green). The data shown are mean ± SEM values from a representative experiment; when not visible, SEM values were within circles. Asterisks indicate a significant difference between pairs. In both panels, horizontal gray lines indicate basal gene expression and vertical dotted lines indicate times needed to reach the peak in expression. If not otherwise specified, in this and following figures experiments were performed with cells from postpubertal female rats. Immediately after dispersion, cells (1.5 million per well) were seeded in 24-well plates and cultured overnight in horse serum-containing GnRH-free medium. After 20 h incubation, medium was replaced with fresh 0.1% BSA-containing medium with GnRH or D-Ala6.

