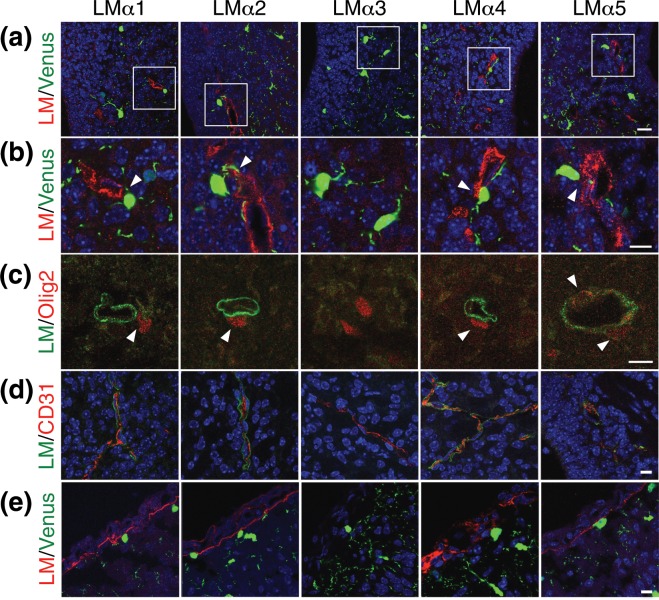
Figure 1.
Expression of laminin α chains in P2 Sox10-Venus and WT mouse brains. (a) Immunohistochemistry of laminin α chains (red) in the ventricular/subventricular zone of P2 Sox10-Venus mouse brains. (b) Higher magnification images of the boxes in (a). (c) Immunohistochemistry of laminin α chains (green) and Olig2 (red) in P2 WT mouse brains. (d) Immunohistochemistry of laminin α chains (green) and CD31 (red) in P2 WT mouse brains. (e) Immunohistochemistry of laminin α chains (red) in the pia of P2 Sox10-Venus mouse brains. DAPI staining (blue) was used to visualize nuclei in (a,b,d,e). Arrowheads: attachment of OPC to vessel. Scale bars: 20 μm (a); 10 μm (b–e). LM: laminin.

