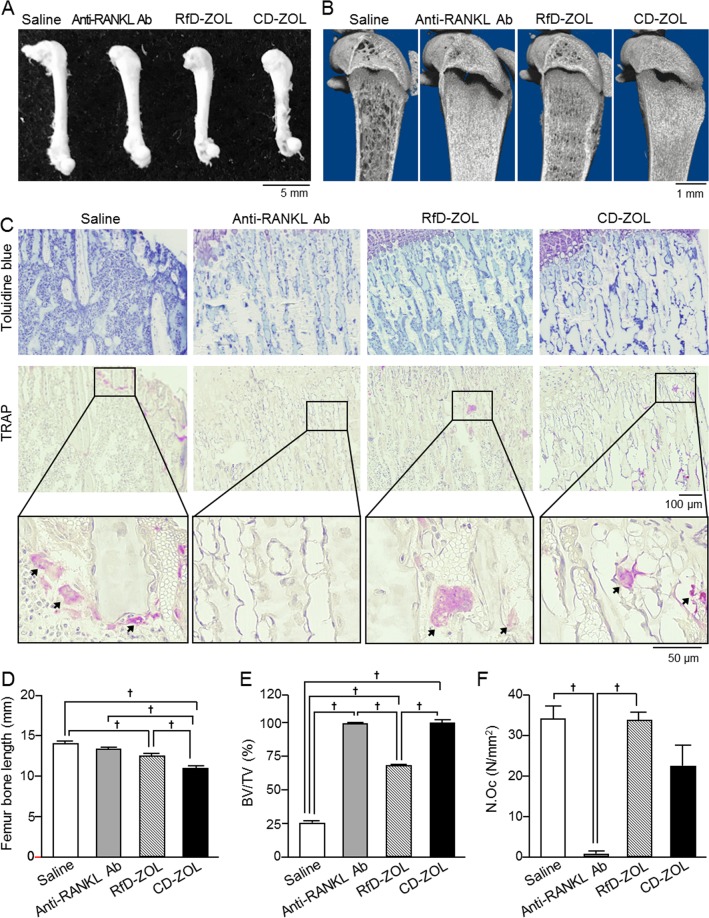
Figure 2.
Effects of long-term administrations of anti-RANKL antibody or ZOL on femur and tibia. (A) Whole femur appearance. (B) Micro-computed tomography (μCT) findings of distal femurs in 8-week-old mice administered saline, anti-RANKL antibody (Ab) at 2.5 mg/kg, RfD-ZOL at 0.08 mg/kg, or CD-ZOL at 3.0 mg/kg weekly for 7 weeks. (C) Findings following toluidine blue staining (upper) and TRAP staining (middle and lower) of proximal tibiae growth plate obtained from 8-week-old mice after weekly administrations of each drug for 7 weeks. Higher magnification images of black-boxed regions in middle panels are shown in lower panels. Arrows indicate TRAP-positive cells. Representative results are shown in (A–C). (D) Femur bone length. (E) Bone volume/tissue volume (BV/TV) ratios were determined by μCT (saline, n = 6; anti-RANKL Ab, n = 5; Rfd-ZOL, n = 6, CD-ZOL, n = 5). (F) Number of osteoclasts (N.Oc) was determined in proximal tibiae following TRAP staining. Four mice from each of the saline, anti-RANKL Ab, RfD-ZOL, and CD-ZOL groups were used. Statistical differences were assessed by one-way ANOVA with Tukey-Kramer’s test. †Statistically significant different from compared to indicated groups, p < 0.05. Error bars represent SEM.

