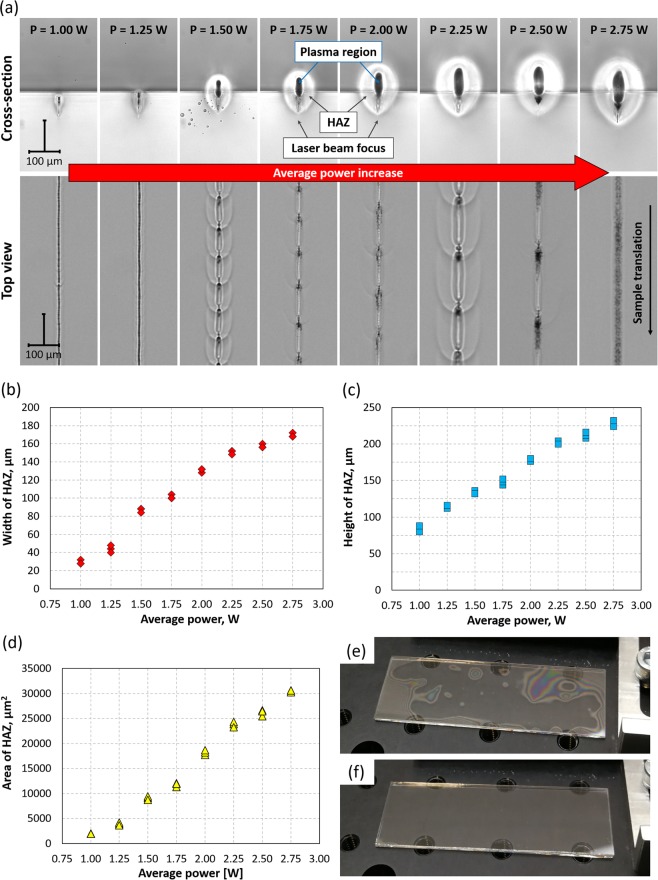
Figure 5.
Laser welding results obtained with a sample translation velocity of 2 mm/s: (a) cross-section and top view of the weld seams generated at the glass-glass interface using different values of average power, (b) width, (c) height, and (d) area of HAZ from (a). Datasets used to plot these graphs are in the Supplementary Materials (see Table S2). A 0.5 mm thick glass plate on a 1.1 mm thick glass plate is shown in (e) after pre-bonding and (f) after welding, using P = 2.75 W and v = 2 mm/s. Weld seams in the form of parallel lines were generated at the glass-glass interface, covering the whole area of glass. The distance between the lines is 0.5 mm.

