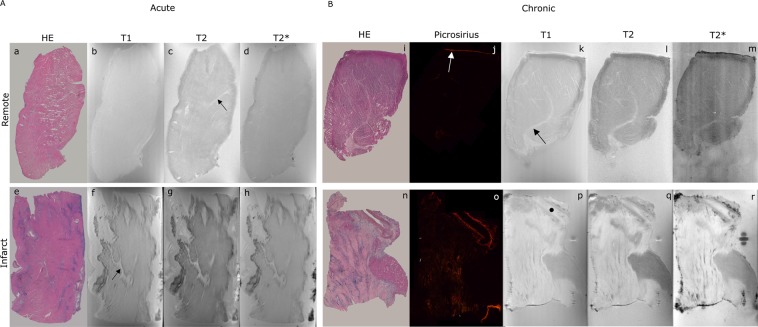
Figure 1.
Histopathological sections and magnetic resonance microscopy images of an acute and a chronic MI experiment. Left panel showing acute MI images (A): Histopathological stain with haematoxylin-eosin (a,e), T1-weighted imaging (b,f), T2-weighted imaging (c,g) and T2*-weighted image (d,h) for remote and infarcted tissues respectively. Right panel showing chronic MI images (B): Histopathological stains with HE (i,n) and picrosirius red (j,o), T1-weighted imaging (k,p), T2-weighted imaging (l,q) and T2*-weighted imaging (m,r) for remote and infarcted tissues respectively. Connective tissue is marked with a black arrow, pericardium is marked with a white arrow and a vessel is marked with a black dot. Areas with and without necrosis (A) or fibrosis (B) (shown by histopathology) can be easily distinguished in terms of image intensity by magnetic resonance microscopy. Abbreviations: HE = haematoxylin-eosin; MI = myocardial infarction; T1 = longitudinal relaxation; T2 = transversal relaxation; T2* = effective transversal relaxation.

