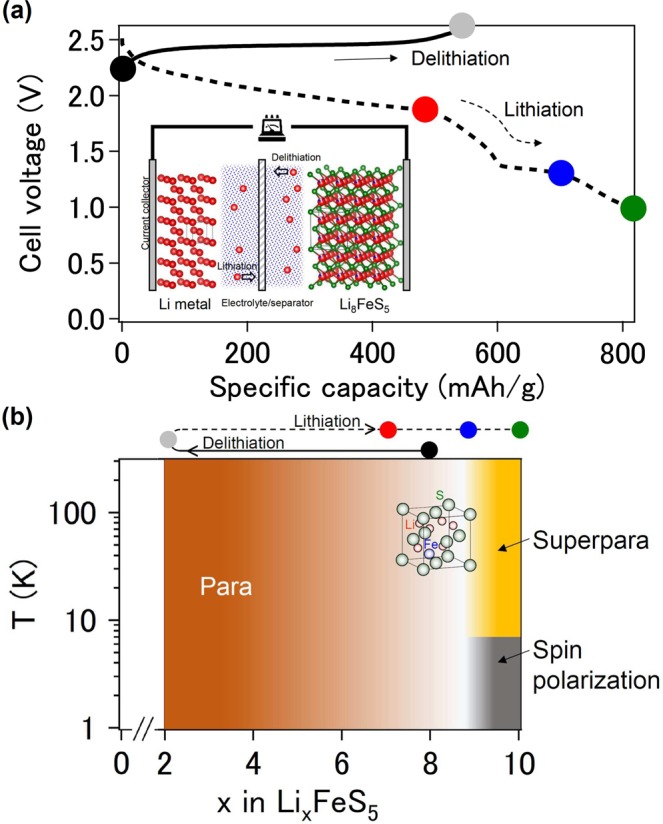
Figure 1.

(a) Delithiation (solid) and lithiation (dashed) profiles for the Li8FeS5/C electrode at 298 K. The lithiation plateaus at approximately 2.0 V and 1.4 V correspond to the reduction of sulfur and Fe–S components, respectively. Inset: Schematic illustration of the Li8FeS5/Li cell. Li, Fe and S atoms are represented as red, blue and green spheres, respectively. (b) Schematic phase diagram of the Li–Fe–S system. The color symbols correspond to those in (a).
