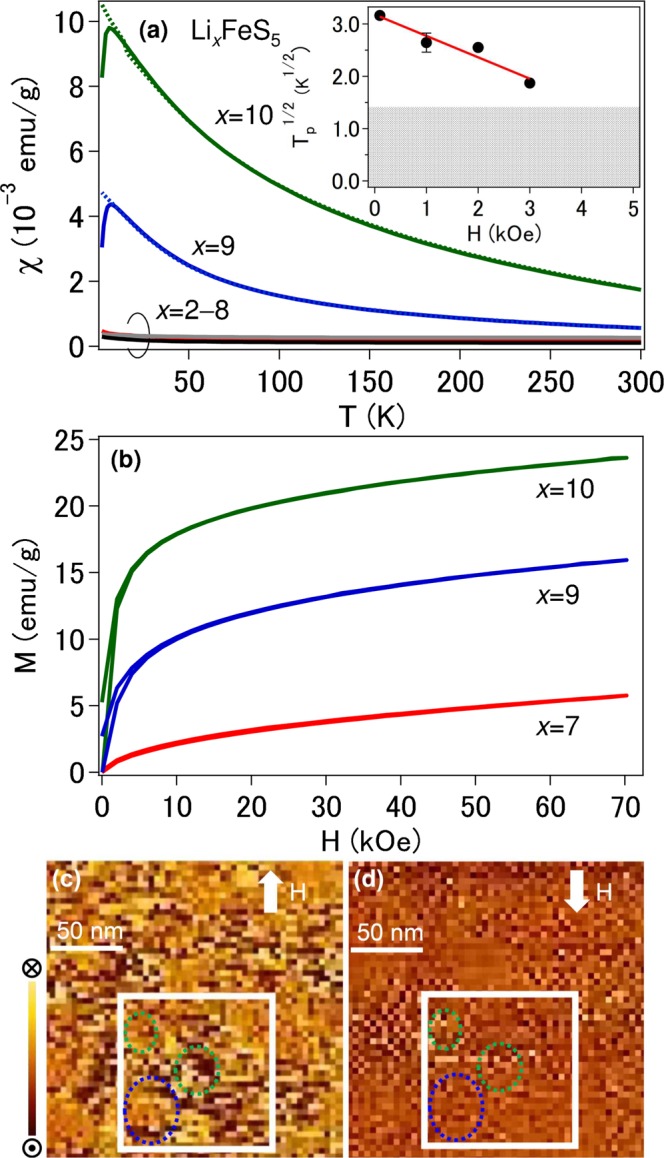
Figure 2.

(a) Temperature dependence of magnetic susceptibility measured in the ZFC mode (solid) and the FC mode (dotted) in a field of 1 kOe. The color corresponds to that in Fig. 1a. Inset: Magnetic field dependence of Tp for x = 10. The solid line is the result of fitting Tp ∝ [1 – (H/H0)]210 to the data. Above 4 kOe, Tp was not observed down to 2 K. The temperature range below 2 K is described by gray. (b) Plot of 2 K magnetization versus magnetic field. (c,d) Two 200 nm × 200 nm MFM images taken of the same area at 150 K (>Tp) after lithiation (x = 10). A magnetic field of 5 kOe is applied (c) along the arrow and (d) in the reversed direction. Scale bar: 50 nm; MFM z-range: 3.6°. The frizzy or fuzzy appearance induced by the scanning process is visible, but we cannot exclude that part. The squares show the MFM images over a 100 nm × 100 nm area.
