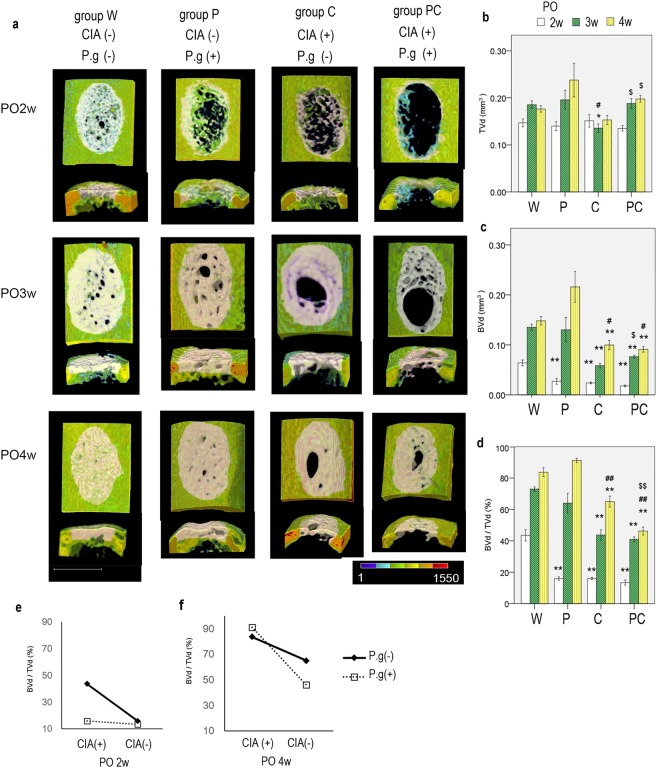
Figure 2.
(a) Three-dimensional computed tomography images of the uni-cortical defect of the left femur are shown (upper, ventral surface of femur; lower, axial section of the area). At 4 weeks postoperatively (PO4w), groups W and P showed higher bone regeneration, with complete full thickness bridging, similar to non-injured cortical bone; in contrast, groups C and PC showed lower bone regeneration. Pink area represents the analysed volume of interest in the well-mineralised regenerated bone area. n = 5–8 per group. White bar represents 600 μm. Coloured area represents bone mineral density in accordance with the colour scale bar (mg/cm3). (b) Quantitative evaluation of the tissue volume in the defect lesion (TVd), (c) well-mineralised bone volume of the defect lesion (BVd), and (d) bone volume fraction (BVd/TVd) of the defect lesion are shown. Data are presented as mean ± SEM. n = 5–8 per group. White, black shaded, and dot shaded columns represent 2, 3, and 4 weeks postoperatively, respectively. *P < 0.05, **P < 0.01 versus group W at the same time point. #P < 0.05, ##P < 0.01 versus group P at the same time point. $P < 0.05, $$P < 0.01 versus group C at the same time point. (e,f) Interaction of collagen-induced arthritis (CIA) and Porphyromonas gingivalis administration (P.g) with respect to mean BVd/TVd in the regenerated bone (PO2w and PO4w: P < 0.001 each). PO2w, 2 weeks postoperatively; PO4w, 4 weeks postoperatively.

