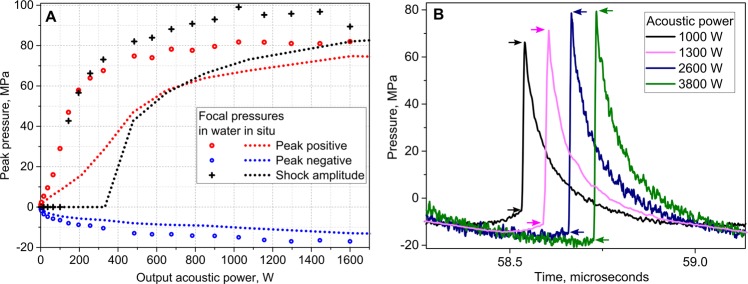
Figure 9.
Acoustic pressure levels at the focus used in the experiment. (A) Peak pressures and shock amplitude provided by HIFU array transducer at the focus in water (symbols) and derated into tissue (dashed lines) versus peak output acoustic power. Tissue attenuation was considered as 1.7 dB/cm, depth in tissue 3 cm. (B) Representative derated acoustic pressure waveforms used in experiments aimed at BH treatment acceleration; increasing peak acoustic output power was used for exposures with pulse durations of 10, 5, 2, and 1 ms. Lower and upper boundaries of the shock front are indicated by arrows; with increasing output power, the shock amplitude changed relatively to peak pressures from being nearly equal to peak positive pressure to being close to peak to peak pressure. Duty cycle was kept constant and equal to 1% in all exposures.

