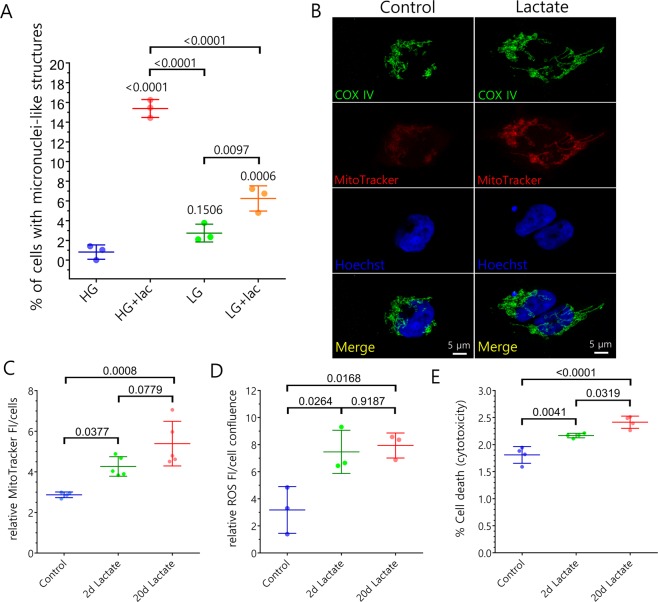
Figure 1.
Metabolic stress induces the formation of micronuclei-like structures in HEK293T cells. (A) Quantification of micronuclei-like structures formation under different conditions (HG = high glucose; LG = low glucose; lac = lactate). Data are presented as mean ± SD and p values are indicated (two-way ANOVA analysis with Tukey post-hoc test; n = 3). (B) Representative confocal images of HEK293T cells under control or metabolic stress conditions during 20 days showing the difference in the fluorescence of MitoTracker Red CM-H2XRos as measure of the changes in mitochondrial membrane potential. Staining for COX IV was used as mitochondrial marker. Hoechst was used as nucleic acid marker. (C) Quantification of the fluorescence intensity (FI) of the oxidized form of MitoTracker Red CM-H2XRos under control conditions and after 2 and 20 days of metabolic stress induced by lactate. Only the oxidized form of MitoTracker is fluorescent and retained in the mitochondria as measure of the its metabolic activity. Data are presented as mean ± SD and p values are indicated (ANOVA analysis with Tukey post-hoc test; n control = 4; n treatments = 5). (D) Quantification of reactive oxygen species (ROS) analyzing the fluorescence intensity (FI) of oxidized intracellular carboxy-H2DCFDA after incubation under control conditions and after 2 and 20 days of metabolic stress induced by lactate. Only the oxidized form of carboxy-H2DCFDA is fluorescent and accounts for the amount of intracellular ROS under the studied conditions. Data are presented as mean ± SD and p values are indicated (ANOVA analysis with Tukey post-hoc test; n = 3). (E) Cytotoxicity assay showing the percentage of dead cells under control conditions and after 2 and 20 days of metabolic stress induced by lactate. Data are presented as mean ± SD and p values are indicated (ANOVA analysis with Tukey post-hoc test; n = 4).

