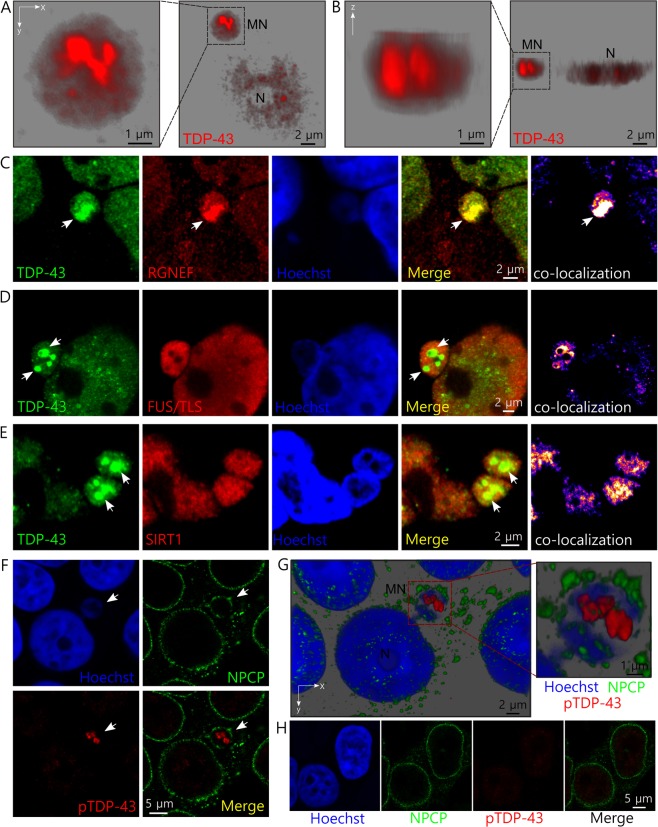
Figure 4.
TDP-43 forms inclusions within micronuclei induced by metabolic stress which co-aggregate with endogenous RGNEF in HEK293T cells. (A,B) 3D reconstruction from confocal set of images of a HEK293T cell showing TDP-43 aggregates within a micronucleus after cellular metabolic stress using lactate. (A) Shows xy axis view and (B) shows z axis view of the cell. MN = micronucleus and N = nucleus. (C) Co-aggregation between endogenous TDP-43 and endogenous RGNEF within a micronucleus after metabolic stress in HEK293T cells (white arrows). (D,E) Absence of aggregate formation for FUS/TLS (D) and sirtuin 1(SIRT1) (E) within micronuclei in HEK293T cells. TDP-43 inclusions are indicated (white arrows). (F) TDP-43 aggregates within micronuclei in HEK293T after metabolic stress cells are immunoreactive for phospho(409/410)-TDP-43 antibody which only stain insoluble inclusions. (G) 3D reconstruction from confocal set of images of the cell in (F) showing the phospo(409/410)-TDP-43 positives aggregates. (H) Control HEK293T cells showing absence of immunoreactive for phospho(409/410)-TDP-43 antibody. Immunofluorescence primary antibodies used were anti-TDP-43, anti-RGNEF, anti-FUS/TLS, anti-sirtuin 1 (SIRT1) and anti-NPCP. Hoechst was used as nucleic acid staining. Scales are indicated in the images.

