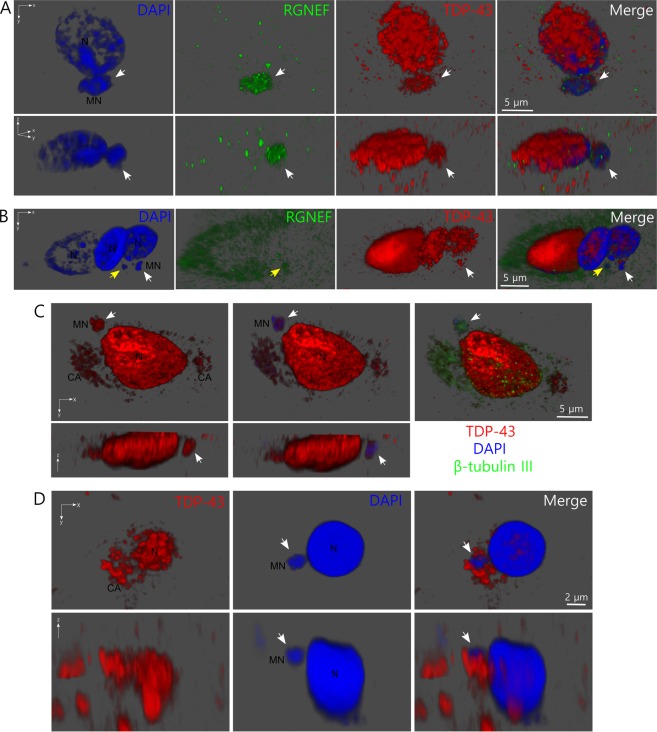
Figure 6.
Micronucleus-like structures are observed in tissue from ALS patients. (A) 3D reconstruction from confocal set of images of a cell showing a micronucleus-like structure (white arrow) in hippocampus from ALS patient number 1. The upper panels show xy axis plane for DAPI staining, RGNEF, and TDP-43 detection. The lower panels show the lateral z axis planes of the images. Note that the micronucleus-like structure is positive for RGNEF, TDP-43 and nucleic acids. (B) 3D reconstruction from confocal set of images of a cell showing micronucleus-like structure (white arrow) in hippocampus from ALS patient number 2. The panels show xy axis plane for DAPI staining, RGNEF, and TDP-43 detection. The white arrow indicates a micronucleus-like structure positive for TDP-43 and nucleic acids. The yellow arrow indicates a micronucleus-like structure positive for RGNEF and nucleic acids. (C) 3D reconstruction from confocal set of images of a cell showing micronucleus-like structure (white arrow) in hippocampus from ALS patient number 3. The upper left panel shows xy axis plane for TDP-43 detection, the middle upper panel shows also DAPI staining and the upper right panel shows additionally the detection of β-tubulin III. The lower panels show the z axis planes for the TDP-43 detection and TDP-43 plus DAPI detection. (D) 3D reconstruction from confocal set of images of a cell showing micronucleus-like structure (white arrow) in cervical spinal cord from ALS patient number 3. TDP-43 and nucleic acids (using DAPI) were detected. Upper and lower panels show xy and z planes of the cell, respectively. Abbreviations: MN = micronucleus-like structure; N = cell nucleus; CA = TDP-43 cytoplasmic aggregates.

