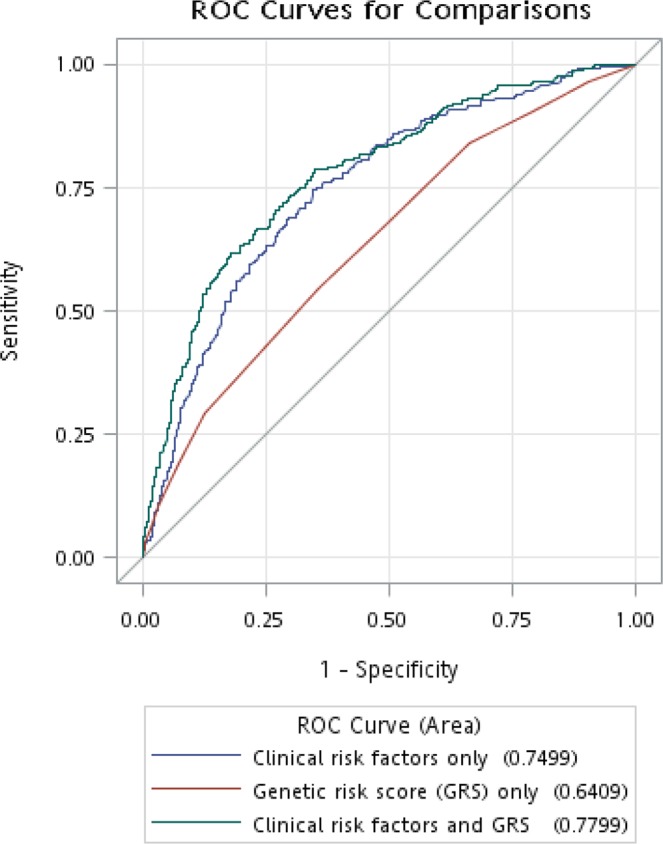
Figure 1.

Areas under the receiver operating characteristics (AUROC) curve for DN status in derivation sample. The AUROC (95% confidence interval) for model 1 (clinical risk factors only), model 2 (GRS only), and model 3 (clinical risk factors and GRS) were 0.75 (0.72–0.78), 0.64 (0.60–0.68), and 0.78 (0.75–0.81), respectively. Model 1 did have better performance than model 2 (P = 5.12 × 10⁻⁵); and that were also found between models 1 and 3 (P = 0.002).
