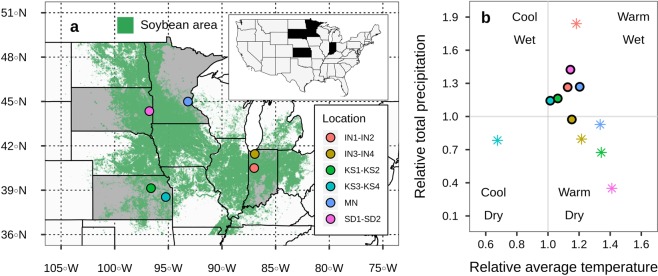
Figure 1.
Map of the six sites (total of 11 soybean environments) (a) and weather characterization (b): temperature and precipitation relative to the average of the last 30 years (1987–2017) for each site and period (asterisks represent the first month after planting and circles represent the average of the entire crop growing season). Each location represented in the map refers to two trials planted in the same site, except for MN, Minnesota. IN = Indiana, KS = Kansas, and SD = South Dakota.

