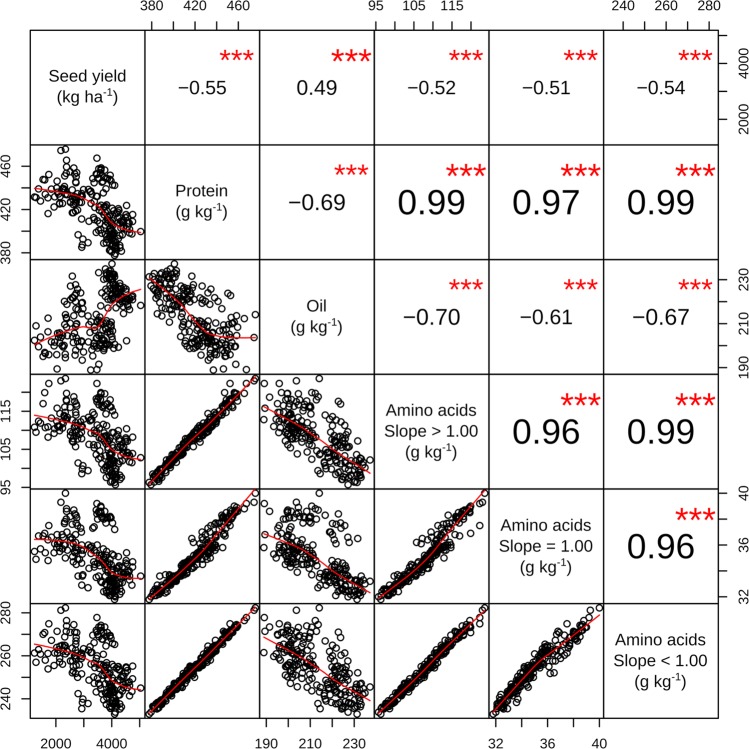
Figure 3.
Correlation scatterplot of Pearson correlation between seed yield, protein, oil, and amino acids concentrations grouped based on their relationship with protein content [slopes greater (arginine, cysteine, and glutamic acid), equal (serine and threonine) or lower than one (alanine, aspartic acid, glycine, histidine, isoleucine, leucine, lysine, methionine, phenylalanine, proline, tryptophan, tyrosine, and valine); Supplementary Fig. S1] in 11 environments evaluating different soybean inoculation methods. The top half of the table shows the correlation coefficients and their significance (***indicates p < 0.001) and the bottom half shows the scatterplot with a red fitted line.

