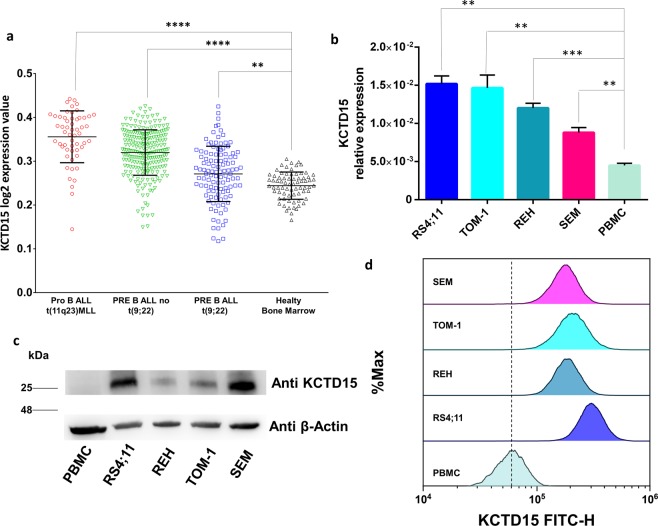
Figure 4.
KCTD15 up-regulation in MILE study dataset (accession number GEO13159). Microarray data of KCTD15 are plotted as Log2 transformed expression values in Pro B ALL t(11q23)MLL (n = 55 samples, red circles), common/Pre-B-ALL without t (9;22) (n = 232 samples, green triangles), PRE B ALL t(9;22) (n = 111 samples, blue squares) and Healthy bone marrow (n = 72 samples, black triangles). ****p < 0.0001. **p < 0.01(Anova with Tukey’s multiple comparison test). (b) KCTD15 mRNA transcription levels in RS4;11, REH, TOM1 and SEM B-ALL in vitro model systems compared to Peripheral Blood Mononuclear Cells (PBMC). **p-value < 0,01. ***p-value < 0,001 (unpaired t-test). The relative expression was determined using the 2−ΔCt method. KCTD15 relative expression is shown as mean +/− SD of four technical independent experiments. (c) Western blot of KCTD15 protein levels, in human B-ALL in vitro model systems (RS4;11, REH, TOM-1, SEM) as well as PBMC. Numbers represent the molecular weight of the protein marker expressed in kDa. (d) Cytofluorimetric analyses of KCTD15 protein levels, in human B-ALL RS4;11, REH, TOM-1, and SEM cell lines and PBMC.

