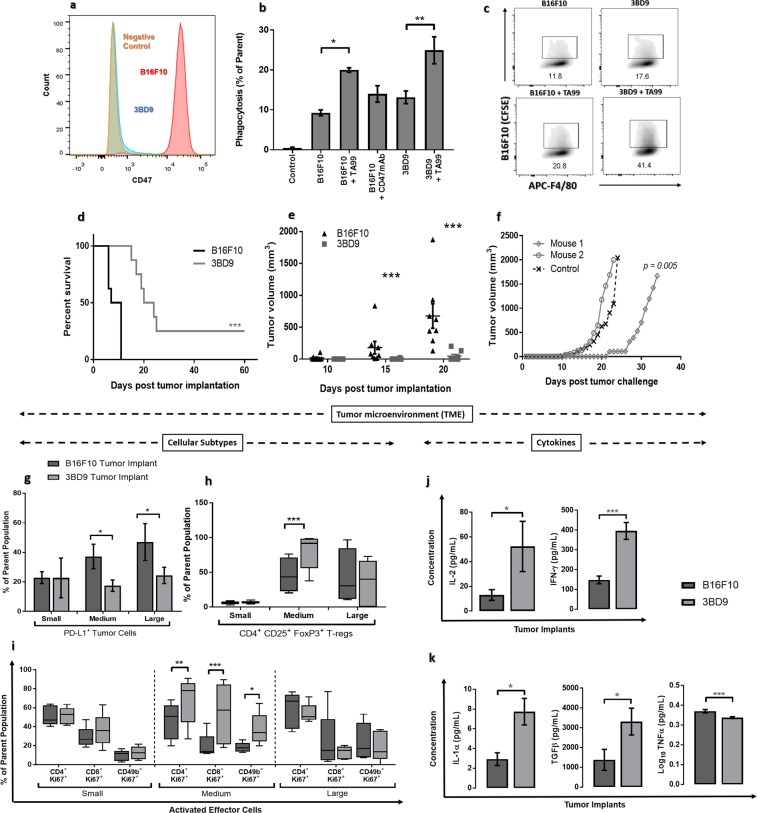
Figure 1.
Validation of CD47 as a target for vaccine development. (a) Flow cytometry histograms showing the CD47 expression in B16F10 cells (red – positive control), 3BD9 cells (blue), and a negative control (orange). (b) Comparison of phagocytosis of B16F10 cells and 3BD9 cells in the presence and absence of the opsonizing antibody, TA99. The data shown are the mean (n = 3) and the error bars indicate the standard error. *p < 0.05, **p < 0.01, one-way ANOVA. (c) Representative flow cytometric density plots showing number of double positive (APC-F4/80+CFSE+) macrophages, depicting the percentage of phagocytosis in each condition. (d) Survival rate of B16F10 or 3BD9 implanted mice **p < 0.01, (e) Tumor growth in B16F10 or 3BD9 implanted mice. Points indicate tumor measurements from individual mice (n = 8). ***p < 0.001, unpaired t test. Error bars indicate standard error. Mantel-Cox test. (f) Tumor growth rate after challenge (second tumor implantation with live B16F10 cells) for two mice that were tumor-free for 60 days after initial 3BD9 implantation. p = 0.005 by linear regression analysis. (g) PD-L1 expression on tumor cells, (h) infiltration of regulatory T cells (T-regs), and (i) activated (Ki67+) effector cells (CD4+ T cells, CD8+ T cells, and NK cells) in the tumor microenvironment. n = 15 mice per group. Concentration profiles of cytokines (j) IL-2 and IFN-γ; and (k) IL-1α, TGFβ, and TNFα in the TME of CD47+/+ B16F10 and CD47−/− 3BD9 tumors. n = 15 for IFN-γ and n = 3 for other cytokines. *p < 0.05, **p < 0.01, ***p < 0.001 by one-way ANOVA using GraphPad Prism. Flow cytometric analysis was performed using FlowJo.

