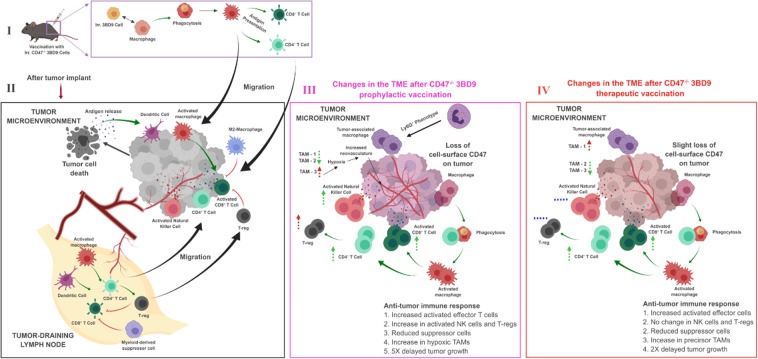
Figure 5.
Immune response in the tumor microenvironment after prophylactic and therapeutic vaccination with 3BD9 cells. The chart depicts the immune activity as observed after vaccination with CD47−/− 3BD9 cells (I) by analysis of the immune phenotypes infiltrating tumors typically after a tumor implant (II), as well as post vaccination with CD47−/− 3BD9 cells, both prophylactic (III) and therapeutic (IV). Black arrows in the figure depict lineage and process, green arrows depict activation, and red lines depict inhibition. Dotted green arrows and dotted red arrows near cell subsets depict anti-tumorigenic and pro-tumorigenic cell types, respectively, and their direction depicts the levels observed (UP arrows – elevated; DOWN arrows – reduced). Blue dotted lines depict no change from control tumors (PBS vaccinated). Cell types are divided into sections based on their phenotypic characteristics. The antigen presenting cells subset shows activated M1-type macrophages and activated dendritic cells; the activated effector compartment includes Ki67+ T cells and NK cells; the exhausted T cell compartment consists of PD-1+ T cells; the tumor associated macrophage compartment includes the Ly6Cint TAMs (TAM-1), MHChi TAMs (TAM-2) and MHClow TAMs (TAM-3).

