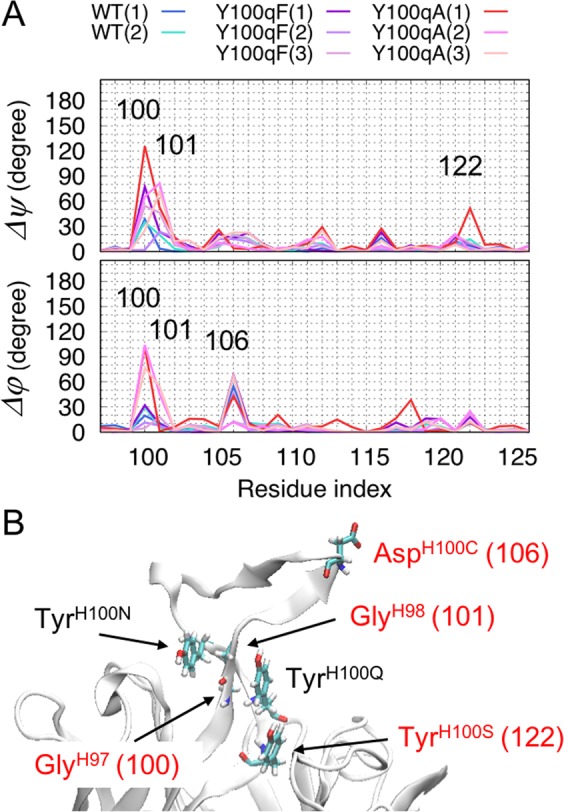
Figure 4.

(A) Distributions of differences in dihedral angles, Δψ (top panel) and Δφ (bottom panel), of residues from the 97th to 126th indices. The results of WT are shown in blue and turquoise, Y100qF in dark-violet, purple and plum, and Y100qA in red, orchid, and pink. (B) The locations and the corresponding indices of the residues showing large differences in the dihedral angles (Δψ, Δφ > 50°) from the WT(3) are represented as stick models and labeled with red letters (GlyH97, GlyH98, AspH100C, and TyrH100S). The residues composing the aromatic core are also shown as stick models and labeled with black (TyrH100N, and TyrH100Q) and red (GlyH97) letters.
