
Figure 1.
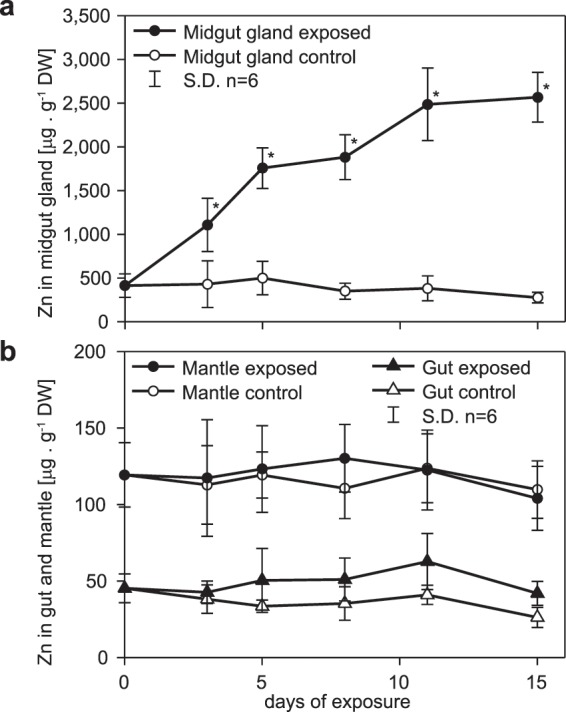
Zinc concentrations (means and standard deviations, n = 6) expressed in µg per g dry weight, shown in organs of slugs exposed to Zn over a period of 15 days. (a) Course of Zn concentrations through 15 days in midgut gland of control (open circles) and Zn-exposed slugs (full circles). (b) Zn concentrations through 15 days in gut (triangles) and mantle (circles) of control (open symbols) and Zn-exposed slugs (full symbols). The asterisks above single values indicate significant differences compared to respective control values (Holm–Sidak method of all pairwise multiple comparison) (p ≤ 0.05).