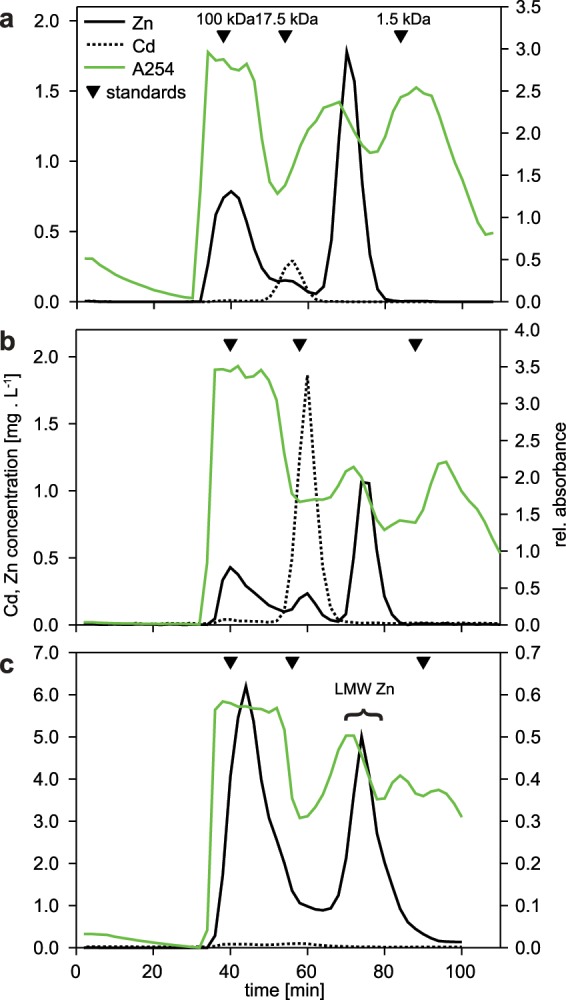
Figure 3.

Gel permeation chromatography (Sephacryl S-100, 25 × 300 mm) profiles of midgut gland homogenate supernatants from control (a), Cd (b) and Zn-exposed Arion vulgaris (c), showing absorptions 254 nm (green line), as well as concentrations of Cd (dotted line) and Zn (black line), as specified in (a). Elution peaks of calibration standards (blue dextran, ≥100 kDa; myoglobin, 17.5 kDa; and vitamin B12, 1.4 kDa) are marked by inverted black triangles above the elution profiles. Fractions collected and pooled for subsequent purification (Fig. 4c) are indicated by brace and LMW Zn label.
