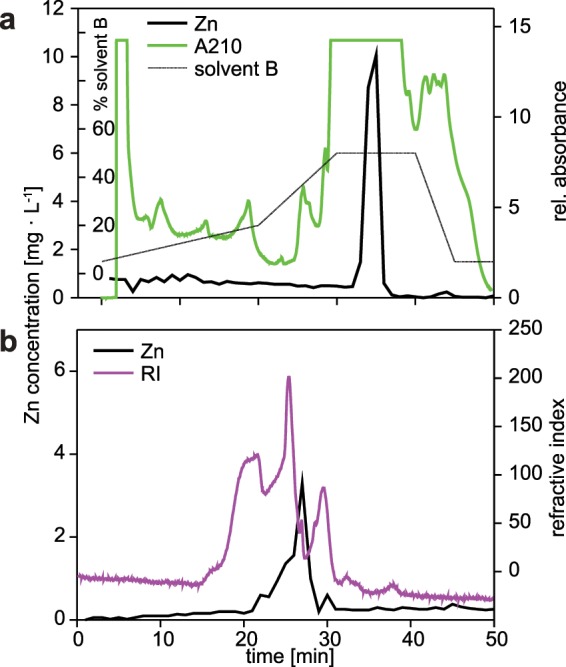
Figure 4.

HPLC separation profile with (a) NH2-column of pooled zinc-containing low molecular weight fractions of gel chromatography showing absorptions at 254 nm (green line), Zn concentration (thick black line) and solvent gradient (thin black line), (b) with Superdex peptide 10/300 GL column of pooled zinc-containing fractions after amino column separation and vacuum concentration with Speedvac. Pink line corresponds to refractive index signal while black line is zinc concentration.
