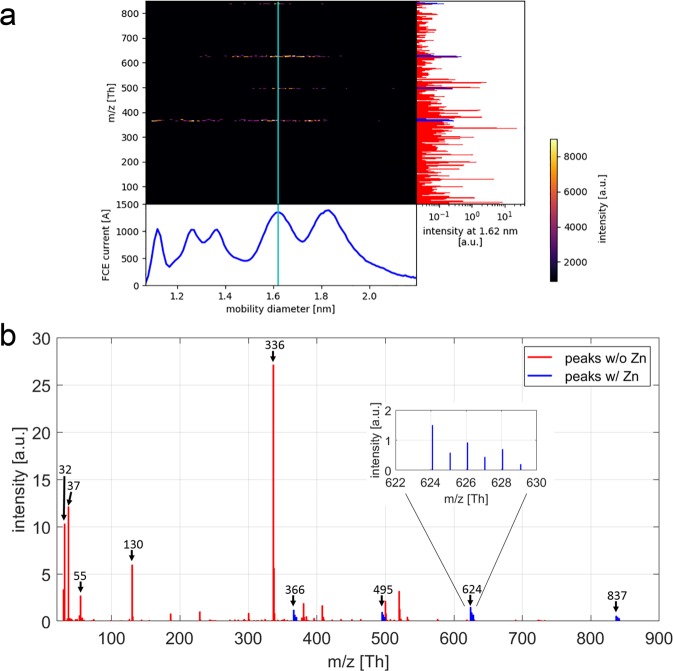
Figure 5.
(a) 2D-mass-mobility plot of the LMW Zn complex showing ion intensities of Zn containing mass peaks using ESI-UDMA-APi-TOF mass spectrometry. Lower panel, ion mobility diameter recorded with the Faraday cup electrometer (FCE). The cyan line marks the mobility diameter of 1.62 nm. Right panel, mass spectrum recorded at the mobility diameter of 1.62 nm. Zn containing ion peaks are shown in blue. (b) Detailed mass spectrum showing four zinc containing peaks with characteristic zinc isotope profile.

