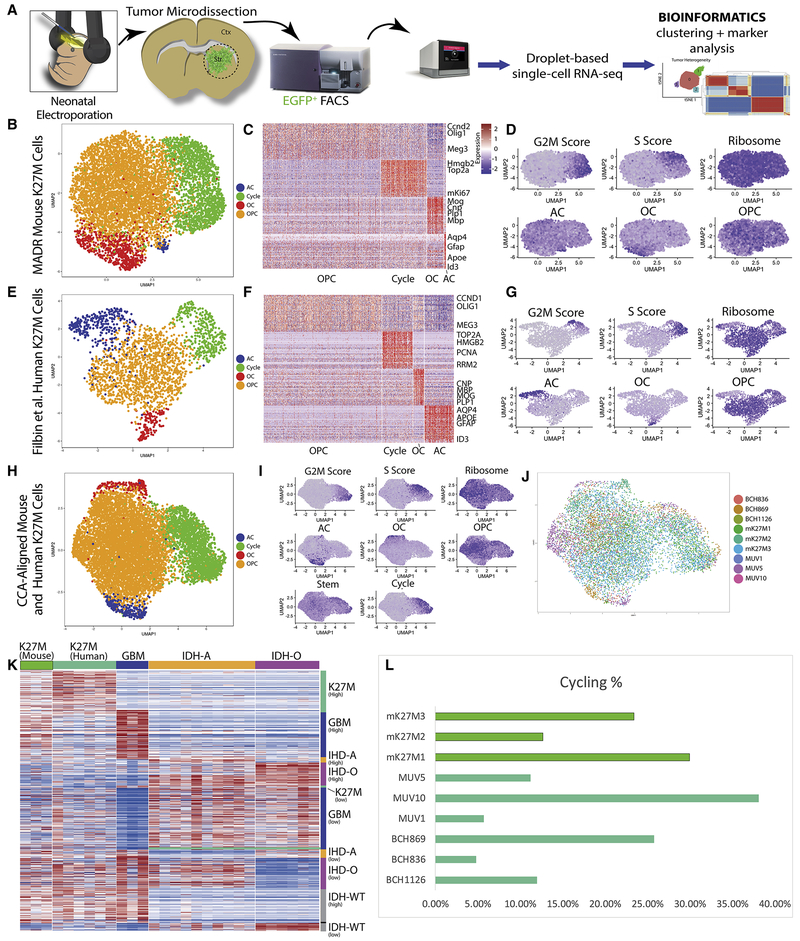
Figure 6: Single-cell RNA-sequencing-based analysis of MADR glioma models.
A) Schematic of cell dissociation and scRNA-seq
B) UMAP depicting CCA alignment of 3 MADR mouse K27M scRNA-seq datasets from 3 distinct tumors, colored by cluster based on HVG programs P1-4 from (Filbin et al., 2018)
C) Heatmap depicting marker genes emerging from unbiased clustering of mouse K27M cells
D) Program and expression featureplots from CCA of mouse K27M tumors.
E) UMAP depicting CCA alignment of 6 human K27M datasets from 6 distinct tumors (Filbin et al., 2018), colored by cluster
F) Heatmap depicting markers genes emerging from unbiased clustering of human K27M cells
G) Program and expression featureplots from CCA of human K27M tumors.
H) UMAP depicting CCA alignment of 3 MADR mouse K27M datasets and 6 human K27M datasets (Filbin et al., 2018), colored by cluster
I) Program and expression featureplots from CCA of combined mouse and human K27M tumors.
J) UMAP depicting CCA alignment of 9 K27M datasets from the mouse and human brain colored by sample
K) Heatmap using gene list from (Filbin et al., 2018) demonstrates a high concordance of gene expression between murine and human K27M glioma cells.
L) scRNA-seq derived proliferation metrics are comparable across mouse and human sample

