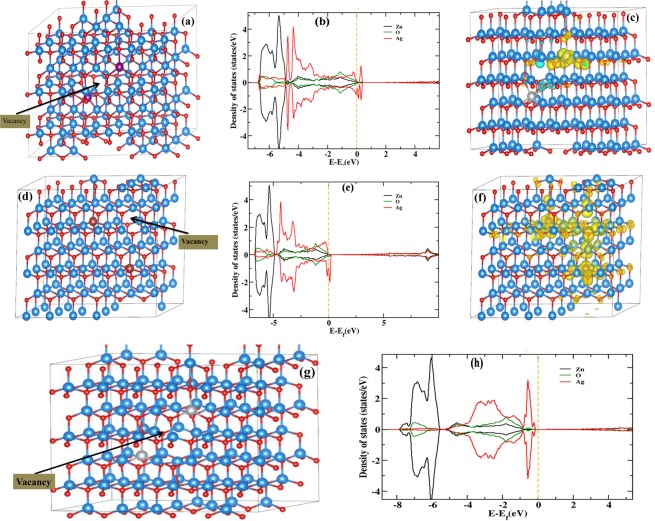
Figure 6.
(a) Two Ag atoms in super cell of 216 atoms (108 Zn and 108 O) and lies between two Ag atoms. Arrow indicates the position of vacancy. (b) Partial DOS of Zn, O and Ag in case of (a). (c) Magnetization density when lies between two Ag atoms. (d) Two Ag atoms in super cell of 216 atoms (108 Zn and 108 O) and lies far from two Ag atoms. Arrow indicates the position of vacancy. (e) Partial DOS of Zn, O and Ag in case of (d). (f) A significant spin density was found the neighboring Zn and O atoms of the impurity and vacancy site. (g) Two Ag atoms in super cell of 216 atoms (108 Zn and 108 O) and lies between two Ag atoms. (h) Partial DOS of Zn, O and Ag in case of (g). The spin-up and/or spin-down DOS is shown above and/or below the abscissa axis. The color code is same for all structure figure: light blue balls represents Zn-atom, red balls represent O atom and gray/magenta balls represent doped Ag atom. Yellow isosurface represents spin up (+Ve) magnetization density and light green isosurface represents spin down (−Ve) magnetization density. In the DOS plot: black line is for Zn, green line is for O and red line is for Ag projected density of states.

