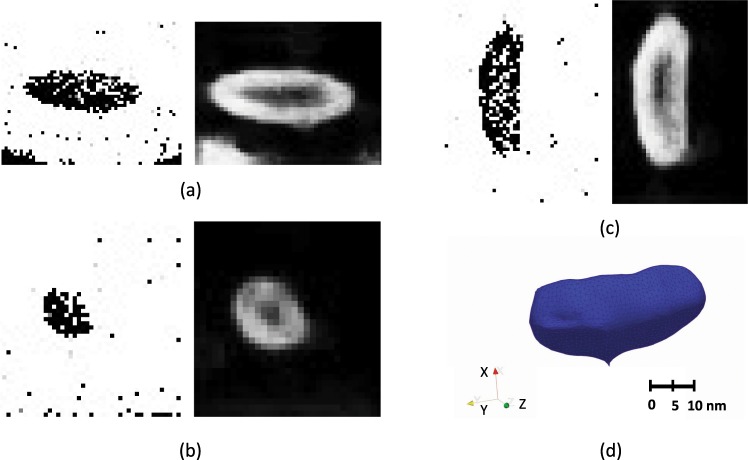
Figure 3.
Two- and three-dimensional edge detection map in the experimentally obtained APT data set from an L12-strengthened Al-Si-Sc-Er superalloy. (a) Concentration space (left) and edge detection map (right) of a slice along the X-direction, (b) Concentration space (left) and edge detection map (right) of a slice along the Y-direction (c) Concentration space (left) and edge detection map (right) of a slice along the Z-direction (d) the edge surface obtained by merging the edges on slices in the X-, Y-, and Z-direction.

