Figure 3.
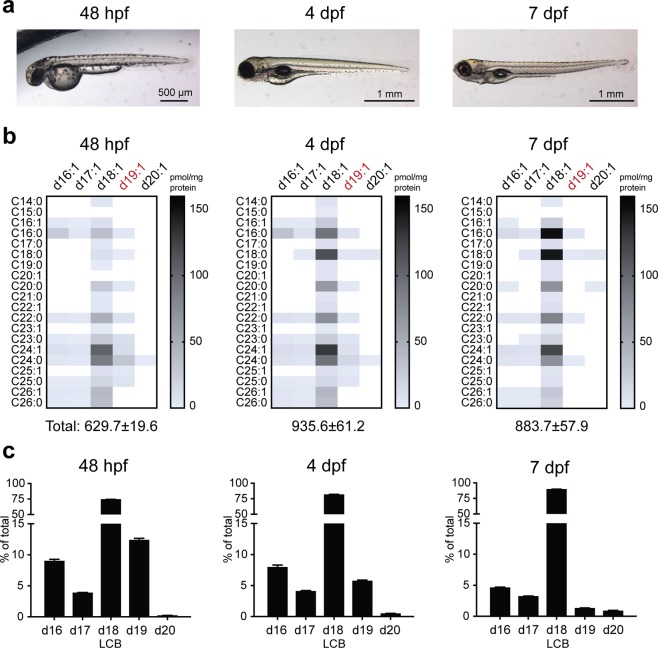
Ceramide regulation during zebrafish embryogenesis. (a) Zebrafish at 48 hpf, 4 dpf and 7 dpf. (b) Heatmap of ceramide content in 48 hpf, 4 dpf and 7 dpf larvae, demonstrating time-dependent reduction in the majority of d19:1 (highlighted in red) ceramides (see Table S3 for quantifications). (c) LCB distribution of all detected ceramides from 48 hpf, 4 dpf and 7 dpf larvae. n = 4 per group. Representative data from two independent experiments are shown. Additional verification of LCB distributions in 48 hpf embryos (n = 5 total) was performed via untargeted lipidomics (Supplemental Methods).

