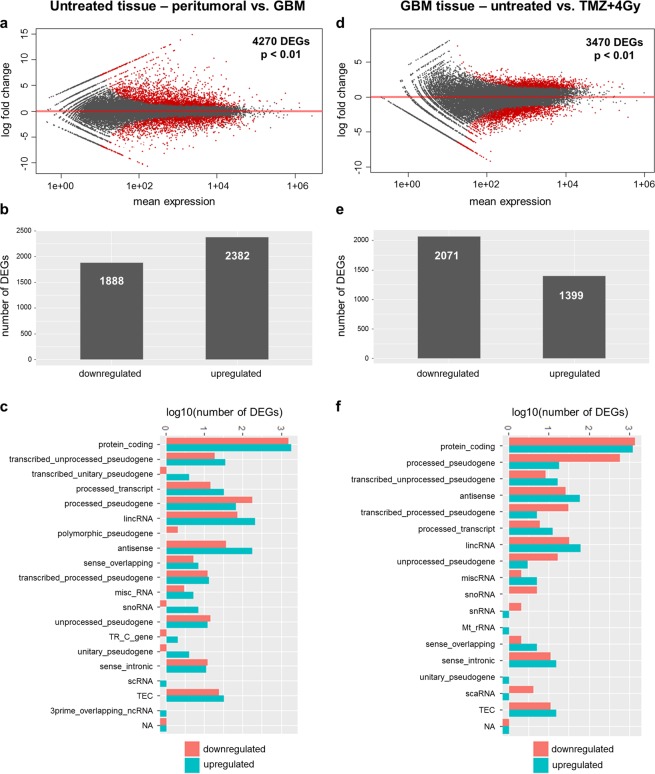
Figure 4.
Differentially expressed genes (DEGs) between peritumoral brain and GBM tissue. Analysis of differentially expressed genes (DEGs) between untreated peritumoral brain tissue of zone III and GBM tissue samples of zone I (a–c) and between untreated and treated GBM samples (d–f). (a,d) Significantly regulated transcripts are indicated in red (p < 0.01). (b,e) Number of down- and upregulated genes in both comparisons. (c,f) Biotype of down- (red) and upregulated (blue) transcripts in both comparisons. TEC = to be experimentally confirmed, NA = not available.

