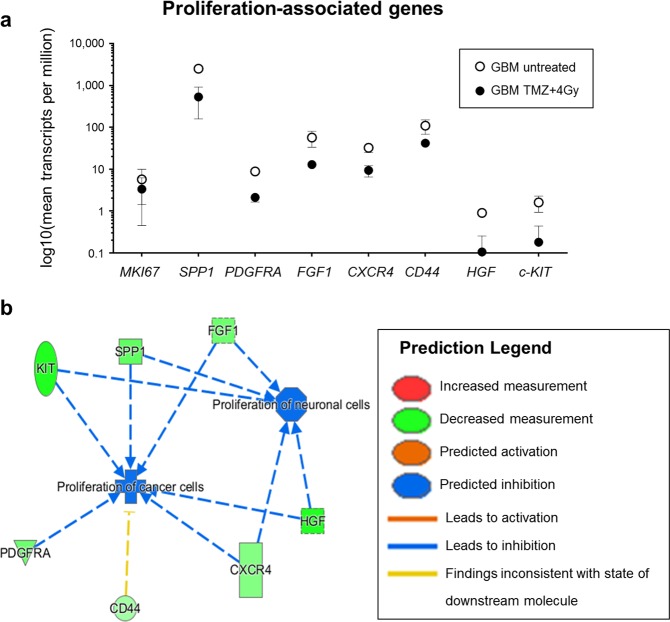
Figure 5.
mRNA expression indicates an inhibition of proliferation after treatment. The differentially expressed transcripts in treated versus untreated GBM tissue were compared to a list of proliferation-associated genes obtained from the Ingenuity® Pathway Analysis (IPA®, QIAGEN). 190 genes were found to be present in both lists. Transcripts per million of some of these genes are displayed in (a). Knowledge base analysis with IPA® indicates an inhibition of proliferation of neuronal and cancer cells (b, blue lines). Green symbols represent a decreased measurement of the respective transcript.

