Figure 5.

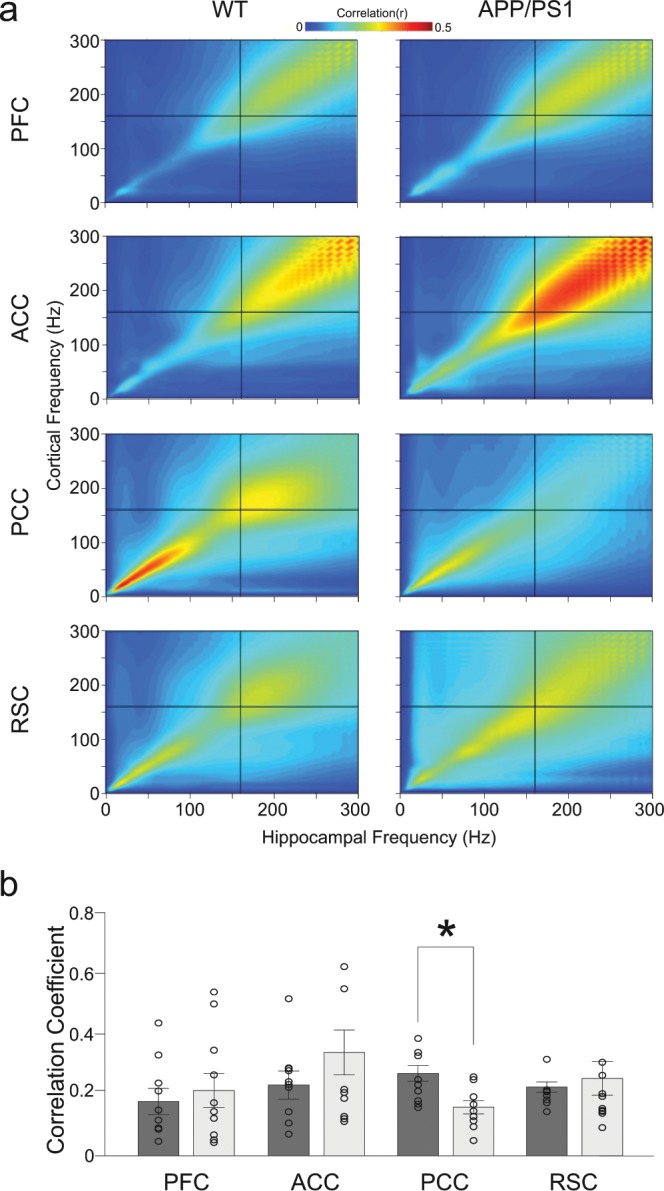
Comparison of cross-frequency power coupling between cortex and hippocampus in WT and APP/PS1 mice. (a) Comodulograms showing coupling between different cortical areas and CA1 during occurrence of cortical ripples, after learning session, averaged over 9 WT and 10 APP/PS1 animals. The cross indicates the mean frequency of cortical ripples. (b) Mean correlation coefficient between hippocampal and cortical activity in the cortical ripple frequency band (140–180 Hz). No statistical differences between WT (dark bars) and APP/PS1 group (light bars) were found except higher synchronization between CA1 and PCC in WT compared to APP/PS1 animals (P = 0.014, Wilcoxon rank-sum).
