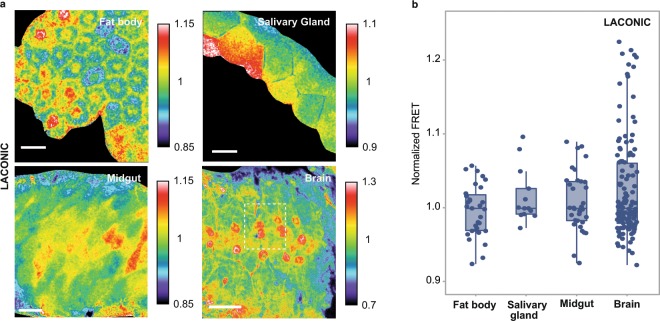
Figure 2.
Laconic reveals single-cell variations of stationary lactate levels. (a) Laconic FRET maps of a fat body, salivary gland, larval midgut (alkaline region, next to the midgut/hindgut junction) and larval brain (ventral nerve cord). In all four organs, cells with various different endogenous levels of lactate can be distinguished. In the brain sample, the specific area marked with a dotted line is analyzed in more detail in Supplementary Fig. 2. Scale bar: 50 μm. (b) The points represent the average FRET signal of each cell shown at the images of panel (a). Data distribution is represented by the box and whiskers graph.

