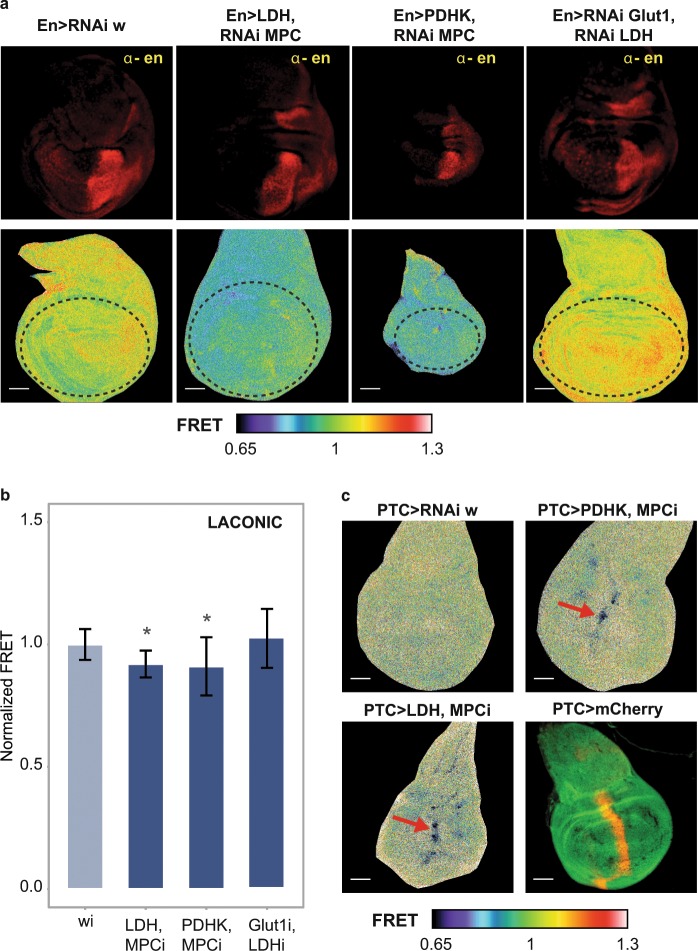
Figure 5.
Tissue bioenergetic metabolism can be genetically rewired. (a,b) Laconic FRET maps and quantification of the FRET signal in larval wing discs, in which the expression of the indicated genes has been manipulated at the posterior compartment of the disc with en-Gal4. The upper panel shows the position of the posterior compartment, revealed by anti-En immunostaining. Dotted lines mark the region in which the FRET signal was determined. Data represent the media +/− SD; *p < 0.05 Dunnet’s Test; n ≥ 20 per group. (c) Laconic FRET maps of wing discs where the combined genetic manipulations indicated on each column were carried out at a restricted domain in the anterior/posterior frontier using the ptc-Gal4 driver. Red arrows mark groups of cells with increased lactate levels. The last panel shows the extension of the ptc domain as revealed by ptc > mCherry.

