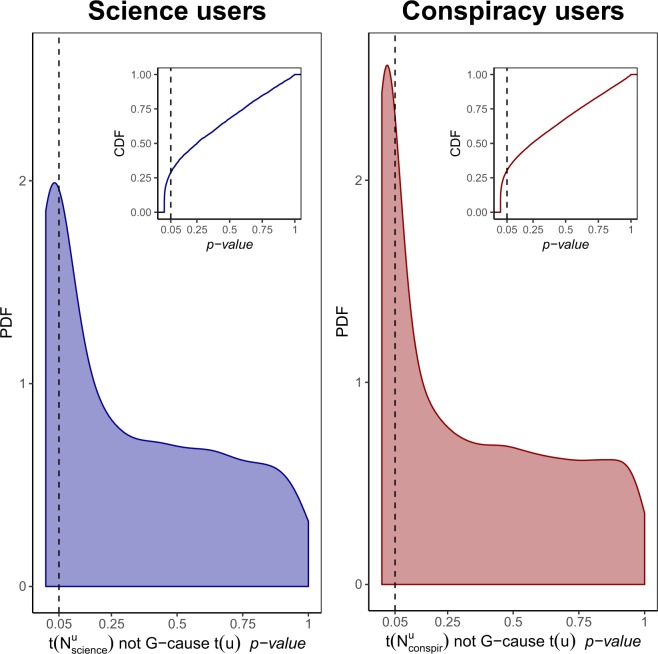
Figure 10.
The causal effect of the polarized neighborhood liking activity on the temporal distribution of likes of a polarized user. PDF of p-values of Granger causality tests performed for investigating a causal effect of () on for any science user in (left panel) and any conspiracy user in (right panel). The inset plots show the cumulative distribution function (CDF) of the same quantities. Graphics show that the null hypothesis can be rejected as false.

