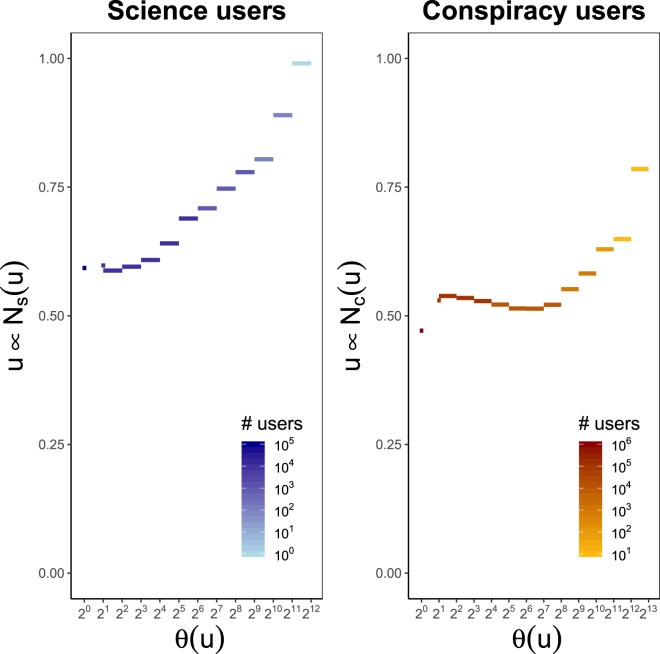
Figure 8.
The distribution of likes of a polarized user across her community pages is proportional to the distribution of likes expressed on the same news sources by her neighborhood part with likewise polarization. In the left panel, for any user , we show the cosine similarity between the vectors u and Ns(u) whose kth component is the number of likes expressed by u and on the kth page of , respectively, versus the number of likes . Segments represent the average of the cosine measurements regarding users with a liking activity in the range of the corresponding bin. The right panel shows the same quantities for polarized users in .

