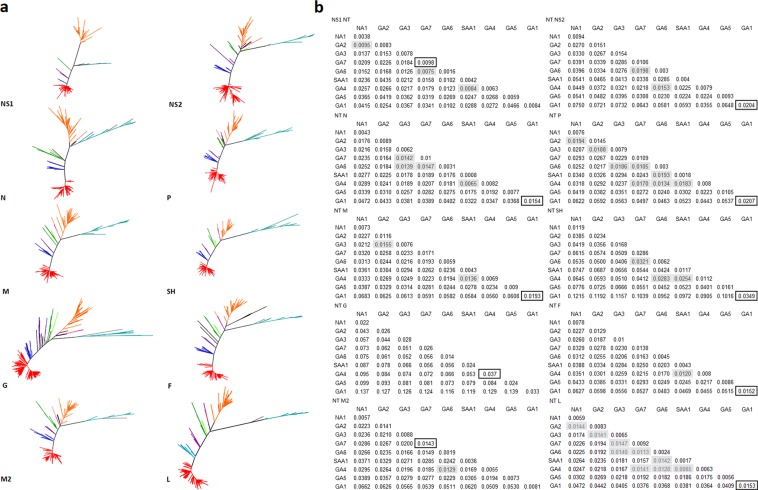
Figure 6.
Phylogenetic analysis of RSV group A. Maximum Likelihood Trees for NS1, NS2, N, P, M, SH, G, F, and M2 genes. (a) Proportional (p) nucleotide distances calculated between and within RSV-A genotypes for each gene. (b) Values in black squares indicate the lowest intragenotype distance for each gene; gray shaded values indicate intergenotype p-distances that are lower than the intragenotype threshold established for each gene.

