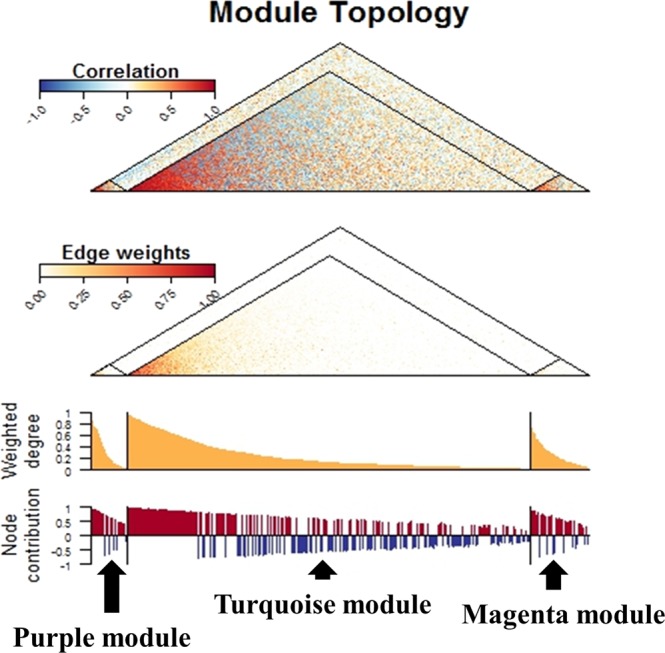
Figure 3.

Preservation of modules identified in gene expression profiles of Sham-treated immortalized B cells from childhood asthmatics in gene expression profiles of Sham-treated peripheral mononuclear cell from adult asthmatics. The first (top) panel shows a heatmap of pair-wise correlations among the genes comprising the turquoise, magenta, and purple modules. The second panel shows a heatmap of the edge weights (connections) among the genes comprising the three modules. The third panel shows the distribution of scaled weight degrees (relative connectedness) among the genes comprising the three modules. The fourth panel shows the distribution of node contributions (correlation to module eigengene) among the genes comprising the three modules. Genes are ordered from left to right based on their weighted degree in the discovery cohort, so as to highlight the consistency of the network properties in the replication cohort.
